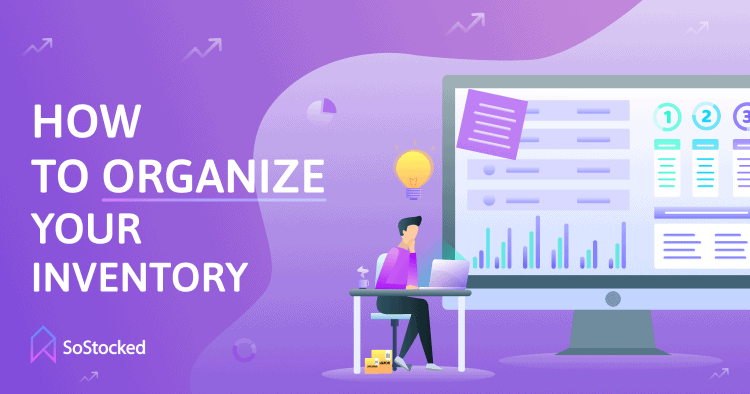
How To Organize Inventory
Best Ways To Organize Inventory With SoStocked and Spreadsheets Using Dashboards To Streamline Data
Overwhelmed with too much inventory data? Can’t figure out how to organize it all? Want your inventory to better inform your marketing and scaling decisions?
In my experience, when there’s too much data, and it’s too cluttered, it’s easy to get overwhelmed and even miss out on opportunities.
Today, we’re going to talk about tidying that up and organizing inventory data! I’m going to address how to streamline your data to make it work for you and how to customize dashboards for inventory forecasting and reordering.
SoStocked is designed, in part, to streamline inventory data, so let’s look at some features in our Amazon inventory management software that illustrate how to organize your data efficiently. If you are not at the point of adopting software like SoStocked, this is something that you could apply on a spreadsheet level as well.
Let’s go! 💪

In this How To Organize Inventory guide, we’ll take a look at:
Custom Dashboards That Organize Inventory
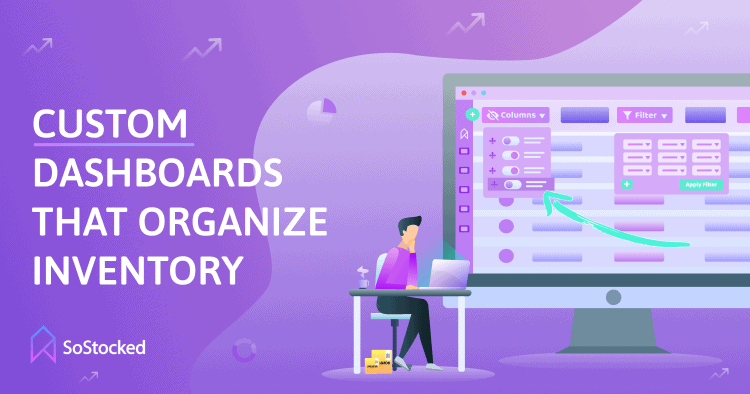
We’ve built customization of dashboards into SoStocked so that you can create individual reporting based on the data you want to see, all done through a filtering process. SoStocked is highly customizable, and our systems make it easy for you to remove the clutter from your data.
I highly recommend that you do this – for simplicity and sanity’s sake!
For example, if you wanted to build an Inventory dashboard that showed specific data in a particular order, you could do that. Or, if you are interested in only seeing products from a specific supplier, you can do that as well. You can also save your filters as a specialized report or as a Favorite, and it will show up at the top of the page as a 1-click option. If you only want to see inventory in a specific marketplace, you can use the same filtering feature within our Forecast section.
Remember that Excel spreadsheets have filters to help you convey the same types of reports if you aren’t using SoStocked.
Order Tracker For Organizing Inventory
The Order Tracker is another vital feature. The order tracker shows you:
- What’s In Production
- What’s En Route and to where
- Who has possession your inventory
- Where it’s coming from (supplier, warehouse) and where it’s going
If you want to see only the inventory that arrived within the last 15 days, you can create a specific filter that shows everything that came within the previous 15 days. You can also use a filter to view everything that will be landing within the next 30 days, or any number of days. Customize it to whatever fits your needs.
Another way to stay on top of the status of your inventory would be our Inbound Shipments report. This report shows what you have inbound to Amazon and your warehouse. You can also use our Inventory On Hand report to look at how much inventory you have and at each stage in the process from Amazon to warehouse to inbound and in production.
This tool is so versatile. You can create filters and hide or show individual columns.
The Purchase Orders, Work Orders, FBA Shipments, and Customer Orders section all have dashboard features in which you can create filtering. If you are a current SoStocked user and you’re not using these features, it would be valuable for you to start building out custom dashboards to help to inform your business decisions. Organizing your data and creating custom filters is extremely valuable and helps to avoid the insanity of too much data.
Tags That Help Organize Inventory
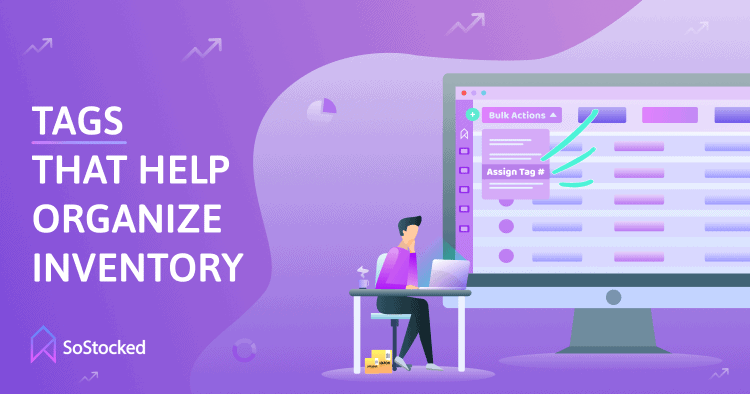
It’s an excellent idea to tag your products based on distinct criteria. We have recently added this feature to SoStocked. For example, you may have specific products that you’ll want to advertise just during Christmas. To assign a tag, select those products then click on the Bulk Actions dropdown and choose Assign a Tag, and then you can either add a previously created tag or create a new one. Once te tag is added to the product, you can even filter by tags. So if you want to look at only Christmas products, for example, you can search by that tag, and all of your Christmas products will pop up.
Using these tags, you can create specific reports or filter data as needed. Bonus DIY tip: You can also add a Tags column to a spreadsheet so that you can filter any product by specific tags. In this way, you can create different groupings.
Tags become very powerful because you can sort by tags in the Forecast section and actually apply forecasting adjustments specifically and only to tagged products, such as adding a Sales Growth percentage for a group of products or switching to using Last Year’s Sales data. You can also use this tag sorting system to see all of the products that need to be ordered for that specific tag.
As a final tip, you can group products by:
- Supplier
- Warehouse
- Marketplace
- Regional Grouping (Brexit, NARF, Custom)
Marketplace Inventory Organization
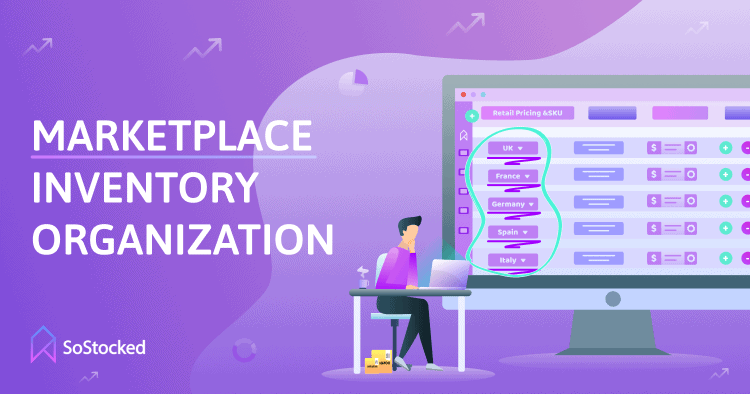
Turning off marketplaces is another feature that can help to control your inventory data. For example, if you’re getting lots of data about Mexico, but you don’t sell in that marketplace, you can go to Settings and then to Connected Amazon Store and turn off Mexico. Save the changes, and then all Mexico data will disappear. You won’t see it anywhere in the system unless you turn it back on in the future; you’ll only see the U.S. and Canada marketplace data.
Pro Tip: If you have many different pages for, let’s say, over 50 products, I would recommend permanently changing the page count for every single report. Make sure to Save Dashboard when you make that change. Until you change it back, it will then show based on the change you made and saved.
Anything that you can do to clean up and condense data and even restrict how many of these data points you see will be helpful. You can also remove data or switch the order in which you’re viewing by creating a New Dashboard. Saving the dashboard view with those new changes, will further simplify the amount of information you’re viewing on a regular basis.
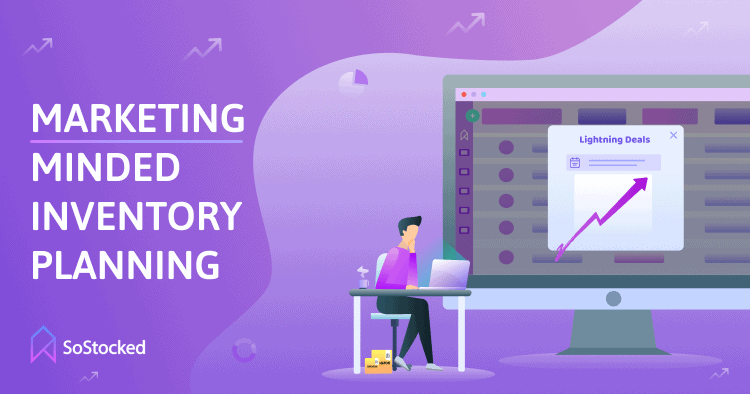
Inventory-Minded Marketing Planning
At SoStocked, we speak extensively about adding your marketing plans into your inventory plans. Inside of the forecast, you can add:
- Additional Sales Growth
- Trends
- Lightning Deals, email or influencers campaigns, etc.
- And numerous other marketing factors
One of the forecasting features that is useful to building out sales plans is Seasonal Sales Spikes. With this tool, you can add an increase (such as a Christmas spike) or a decrease in sales for a specific date range. That spike will then show up inside of your forecast and factor into your recommended inventory transfers and orders.
We call this Inventory-Minded Marketing Planning. It involves using inventory data to direct your marketing decisions, helps to increase your cash flow and your sell-through, and is a great way to get your marketing team to work with your inventory team so that you’re not inadvertently marketing into a stockout.
Too often, we focus on our hero products when other products are just left limping along, costing us fees and tying up capital. However, in a perfect world we’d get those sales to increase and the sell-through to improve. Improving sell-through will help your IPI limits and IPI score and will be better overall for business.
Getting better at inventory-minded marketing will help to increase sales and cash flow, and improve your overall IPI score. To help with this, I recommend looking at a couple of different reports like our Future StockOuts report and a custom Overstock report. Visit our Amazon Seller Dashboards article for more on these reports. Your marketing team should be logging in to look at these reports regularly.
The Future StockOuts’ report is a default report in SoStocked. You do not have to build it as a custom report. You’ll find it at the top as one of the Favorites. It’s going to pull up anything that has a potential risk of stocking out. Using this feature allows you to plan against potential stockout risks by spending less on marketing, making more profit on the sales you do make and potentially avoiding a stockout entirely. If you consistently view this report and send it to your marketing team, you can help them to see what they need to ease up on marketing by, for example, making some changes to PPC bids, like lowering the ones that are costing you in higher ACoS.
Your marketing team must have access to this data so that they don’t drive sales on a product that’s about to stock out when they are doing their marketing. Too often, the marketing team is not talking to the inventory team, and inventory gets driven straight into a stockout. Share this report on a weekly or monthly basis to help to prevent those avoidable inventory mistakes.
Another report that can be valuable is a custom Overstock Report. Your team needs to stay informed on what is overstocked and decide what they can do to drive sales on those particular products. In dealing with overstock, you can consider a cost benefit analysis of these various factors:
- Move inventory at a lower profit
- Increase cash flow
- Get some of that capital back to reinvest
- Potentially gain ranking on on slower moving products to increase sales
For example, if you have a ton of inventory on a product that doesn’t have the best ranking, you might be able to revive that product and use that excess inventory to “buy yourself” a better ranking. Remember, inventory can either be an asset or a liability. Use it as an asset if you have excess inventory by trading lower profit units for increased velocity and ranking. If you don’t, it can remain a liability, costing you in fees and lost opportunities due to tied up capital.
You have to decide to either have it sit as a slow seller and not do a lot for your business, or drop the margins a little bit, push that product hard and see if you can do something with it.
Helping your marketing team to not just focus on your hero products, gets them to start looking at your entire catalog and thinking about cash flow as well. You start “playing the orchestra” of your business then instead of just one instrument.
Ask yourself, “How can I get some of that cash back and put it into new products that are going to make me more money faster?”
Liquidation Reports To Organize Inventory
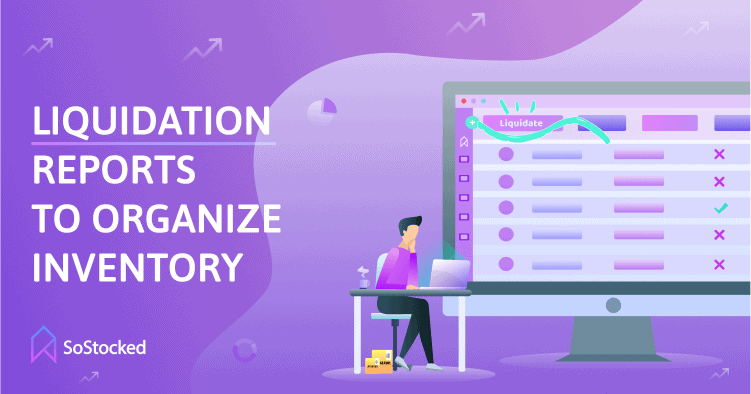
Finally, the last custom report I want to address is the custom Liquidation report for products moving so slowly that it may not be worth it to keep them around anymore. Maybe you’re going to sell out of these products and just move on. In this case, it’s important to force the issue by focusing on getting your money back from them as fast as possible so that they don’t cost you in fees and so that you can put that cash to better use. This is just one more instrument in your orchestra.
Final Pro Tip: You can export all of these reports to Excel using the Cloud buttons found across the site if you don’t want your marketing team to have direct access to your SoStocked account.
Action Items
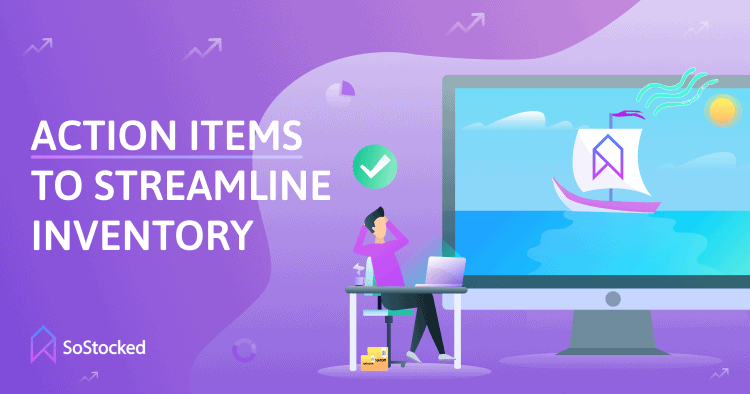
As you can see, SoStocked is prepped and ready to organize and streamline your inventory data so that you can manage it more efficiently. Using our software, you can organize your data to make your life simpler and your business more efficient:
- Create individual reporting based on the data you want through the filtering feature
- View every order you have placed and where it is at in any given time with the Order Tracker
- Avoid the insanity of too much data
- Organize inventory using tags
- Control what and how much data you see at a glance
- Sync your marketing and inventory plans to avoid stocking out and to maximize your cash flow.
What’s YOUR next move to gain back control of your data?
If you have feedback on other reports you have created, please share them with us and send them our way. I’d also love to hear other smart ideas for how you’re looking at your data and in what ways it helps your business!
As always, I hope this information empowers you to be smarter with how you’re looking at your business, alleviates some of the data chaos, and improves your marketing abilities!
Need more information?
- Send Message: We typically reply within 2 hours during office hours.
- Schedule Demo: Dive deeper into the nuances of our software with Chelsea.
- Join Live Upcoming Webinar: New to Amazon inventory management? Learn three inventory techniques you can implement right away.
Chelsea Cohen is an Amazon seller, speaker & consultant. An Amazon expert, her regular clients include 7 & 8-figure sellers. She has been featured on AM/PM Podcast, 7-Figure Sellers Summit, and the Prosper Show & Amazing Summit stages, among others.