15 Amazon Seller Dashboards To Organize Your Business
Get Visibility & Take Action
In this Amazon Seller Dashboards tutorial, we’ll take a look at:
What is a Dashboard?
A dashboard, or “data dashboard” is an information management tool that visually tracks, analyzes, and displays key performance indicators (KPIs), metrics, and key data points to monitor the health of a business, department, or specific process. The term “dashboard” is based on the dashboard of a car. It was invented to give the driver vital information about the engine, such as temperature, fuel level, and oil pressure — so that he/she may drive as safely and efficiently as possible.
In SoStocked, we have created several default Amazon seller dashboards to view vital inventory KPIs. We’ve even programmed in the ability for you to customize and create your own Amazon seller dashboards so you can view your business exactly the way you need to.
Below is a list of our top 15 Amazon dashboards, grouped by their respective home pages, so you can easily navigate through the software and start using these vital tools to improve your business. They also just give you an idea of some of the ways you should be looking at your inventory and your business for improved control and efficiency. Enjoy! 🙌
Amazon Inventory Dashboards
Warehouse Levels Dashboard – Default
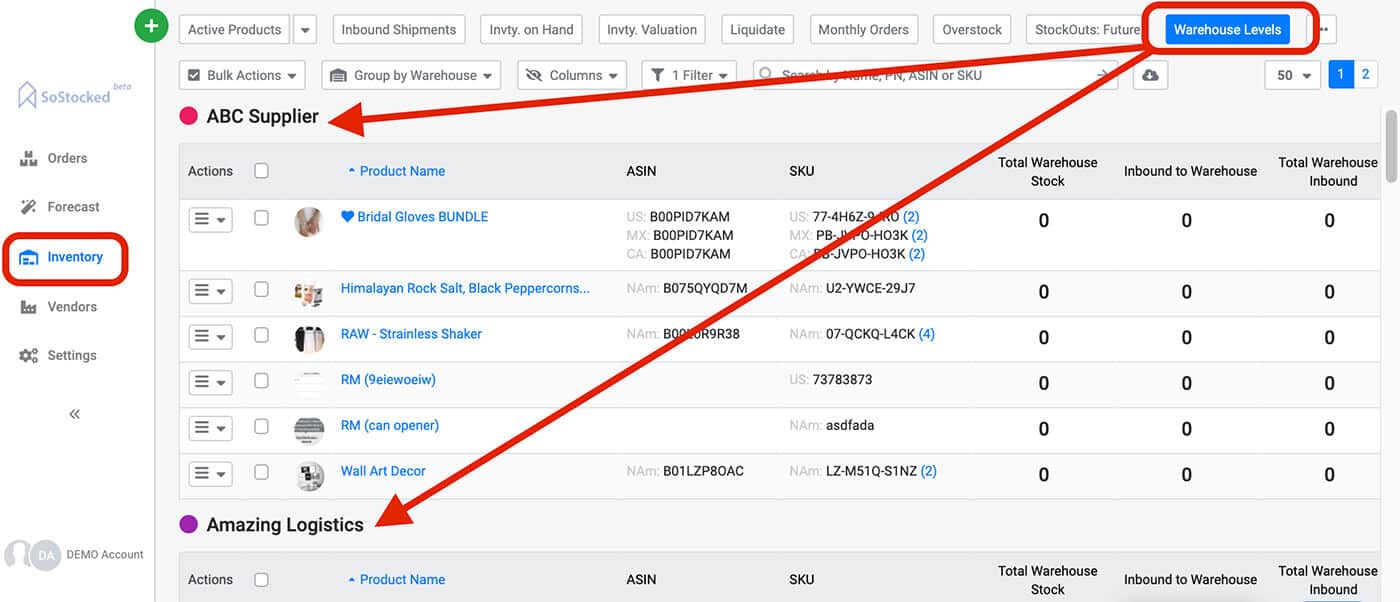
The Warehouse Levels dashboard is for all Amazon physical products business models that utilize additional warehouses outside of FBA. It shows you, by ASIN, what inventory is in every warehouse. This dashboard is grouped by warehouse.
Inbound Shipment Dashboard – Default
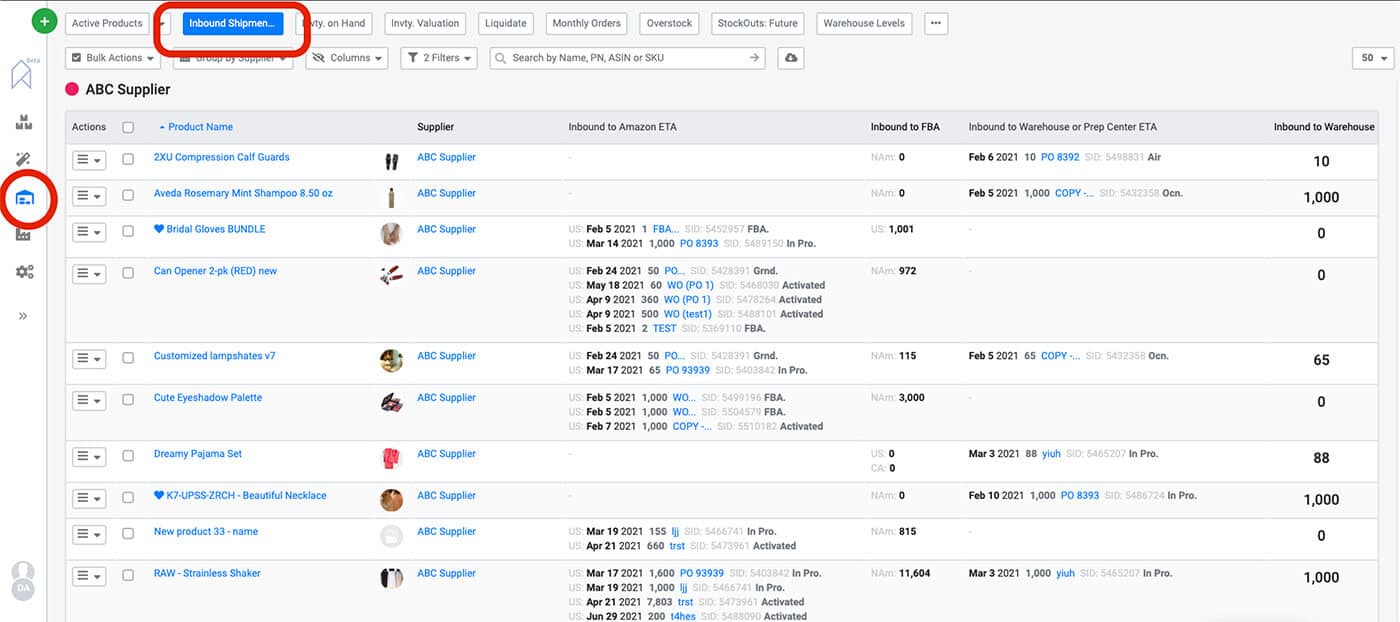
This dashboard is for all Amazon physical products business models. It shows you what Purchase Orders (POs) or transfers/Work Orders (WOs) are coming into Amazon, or coming into your 3rd Party Warehouses (3PLs). This helps track all POs and WOs from production through shipping in one easy view.
Inventory on Hand Dashboard – Default
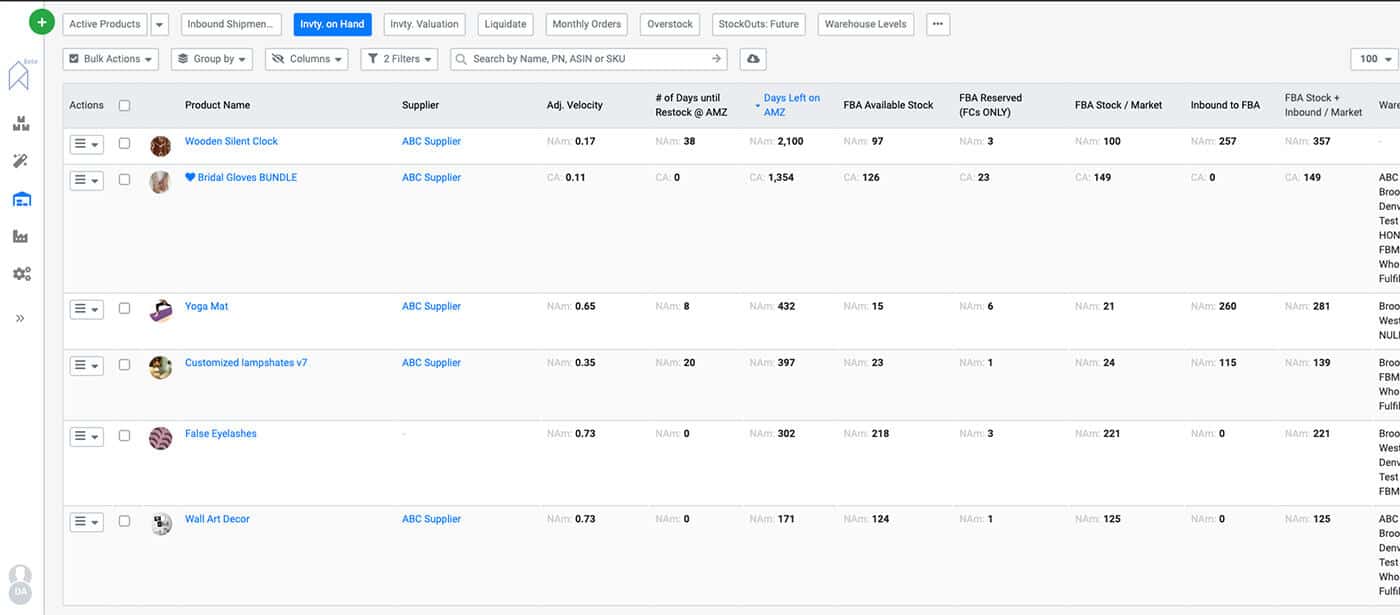
This dashboard is for all Amazon physical products business models. It shows you all Available, Reserved and Inbound FBA inventory, as designated by Amazon. It also shows warehouse stock, inbound total stock, total stock plus inbound. It even includes your Restock Limits and Max Ship Quantity per SKU.
Inventory Valuation Dashboard – Default
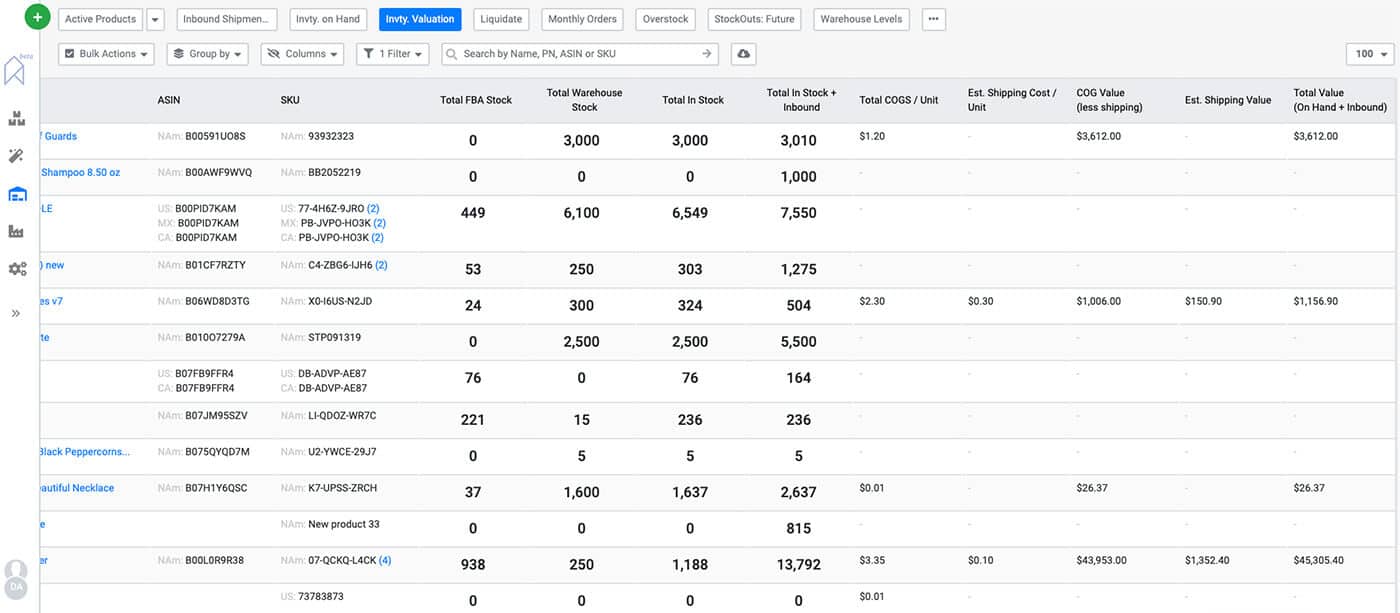
Inventory valuation dashboard is for all Amazon physical products business models. It shows you the total monetary value or Cost of Goods Sold (COGS) of the inventory you have in stock, as well as at your warehouses. Your accountants will love it!
StockOuts: Future Dashboard – Default

The Inventory StockOuts: Future dashboard allows you to anticipate upcoming potential stockouts so you can develop a plan to avoid them. This dashboard is for all Amazon sellers.
Overstock Dashboard – Customized
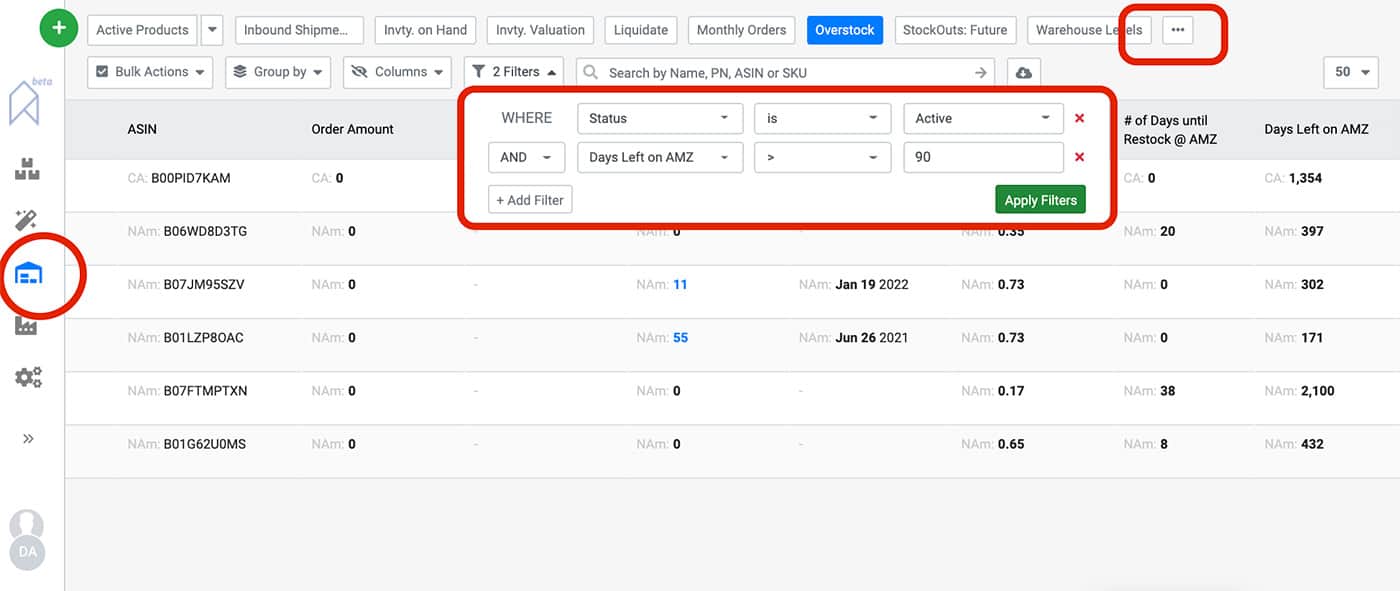
SoStocked gives you the ability to create customized dashboards to view specific data on specific products of your own choosing. Watch this video to learn more about how to build custom dashboards:
This is our customized Overstock Dashboard. Again, this is for all business models selling physical products on Amazon.
We selected the following criteria for our custom dashboard:
- Status is Active
- Days Left on AMZ is greater than 90 days (or whatever you prefer).
This view allows you to see where you have too much stock at Amazon. It can be sent to the marketing team to increase your sell-through rate, avoid expensive storage fees and recover tied-up capital to help scale faster by investing in new products.
You may even be able to use the excess inventory to boost rankings and traffic and increase the sales velocity of those overstocked products to make them more successful. Inventory is a resource and using it as such you can increase ranking and cash flow to help boost your overall business success.
Bonus: Excess Inventory (overstock) and Sell-Through are two Inventory Performance Index (IPI) score factors, so this can help to increase your score too.
Liquidate Dashboard – Customized
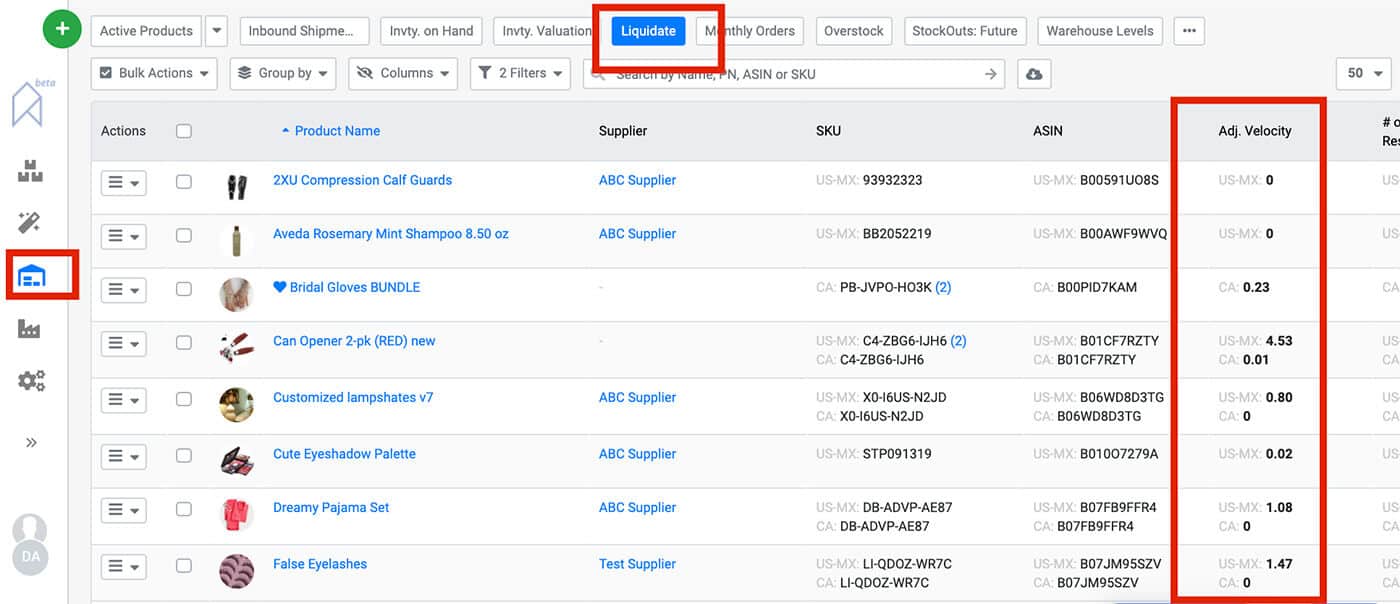
This is our customized Liquidate Dashboard. Again, this is for all business models selling physical products on Amazon.
We’re still on the Inventory page. The filters we selected are:
- Status is Active
- Adjusted Velocity is less than 5 units per day (or whatever you deem to be too slow to keep in stock).
The 5 units per day in the above example is your current Sales Velocity as reported from Amazon in your existing SoStocked Forecasting page.
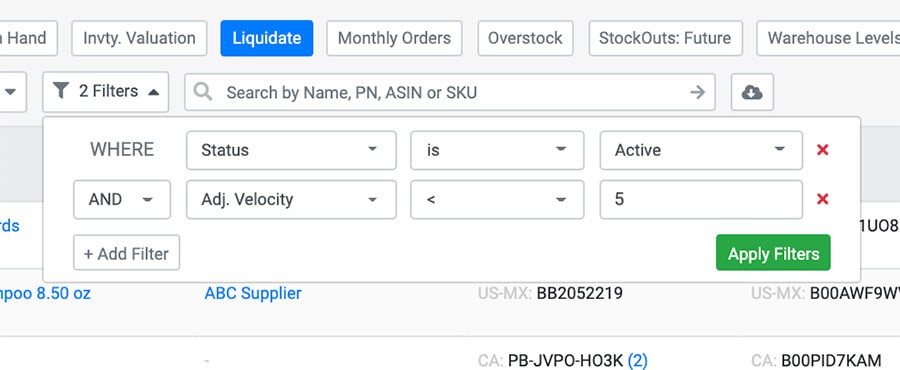
This dashboard would help to identify extremely slow-moving products that are costing you in storage fees, tied-up capital not working for you, etc., so you can liquidate, or boost sales into a viable range.
Pro Tip: Tag products as “Liquidate”, then go into Forecast and Snooze Orders Forever on all tagged products to avoid reordering.
To learn more about tagging products for easy categorization, watch this video.
Amazon Forecasting Dashboards
Orders: 30 Days Dashboard
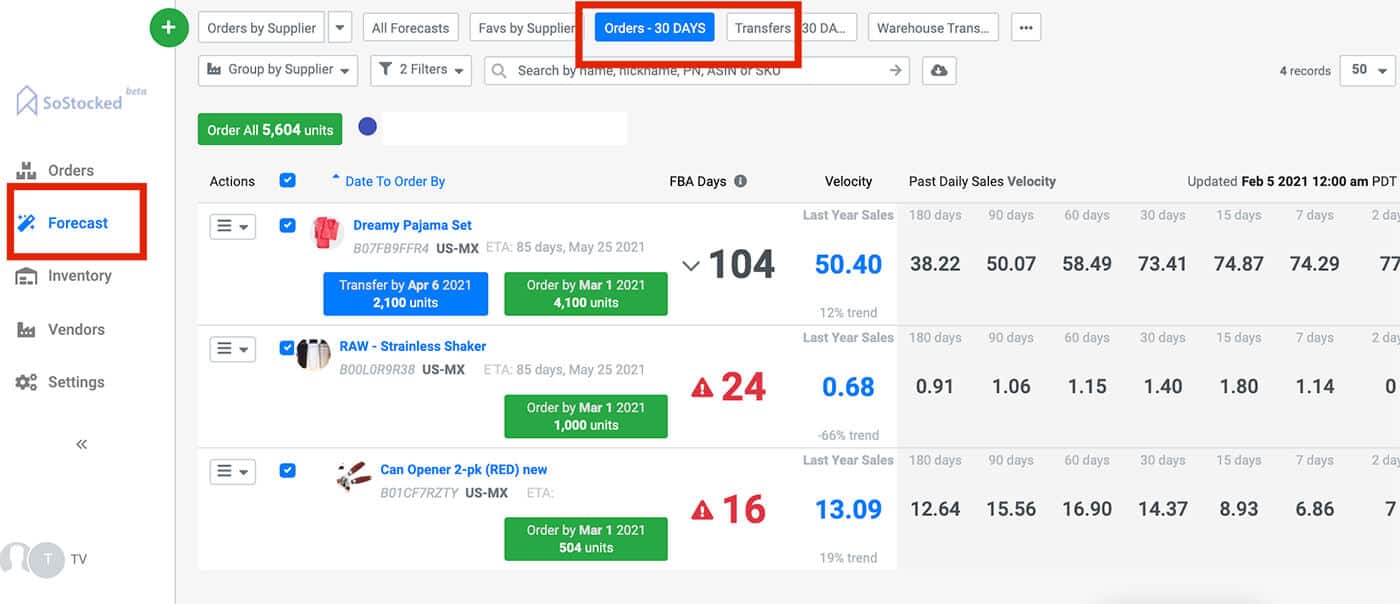
The next few dashboards are found on your Forecast page of SoStocked.
The first one we want to show you is the Orders: 30 Days dashboard. This dashboard filters down all of your future order suggestions to show you only the orders that need to be placed within the next 30 days. It is separated by supplier, so you can place orders for all products from that one supplier at the same time, or one specific product at a time.
As with all dashboards, this one can be edited or customized to your order schedule. For example, if somebody prefers to order once every 45 days, you can simply click the “Filters” button. Then make any changes you prefer.
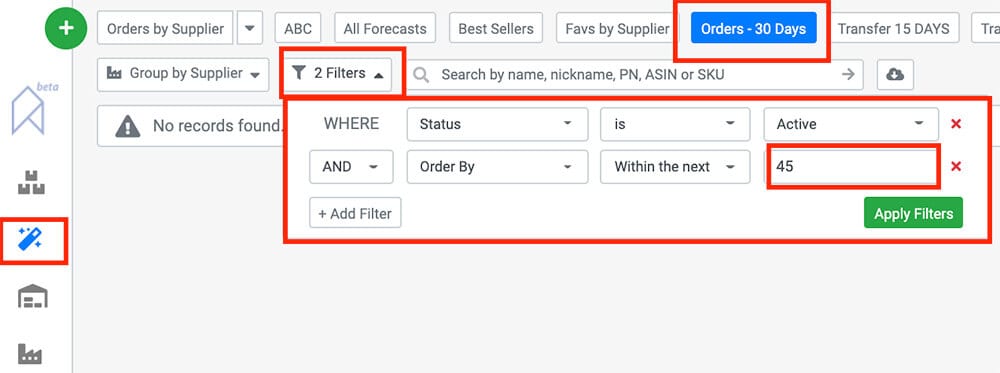
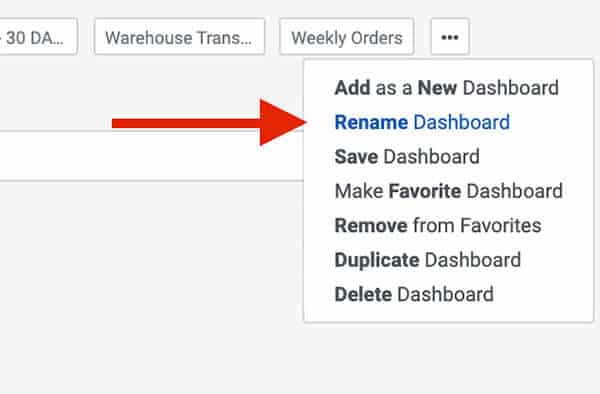
After you have edited the filters for this dashboard, you can save & rename the dashboard by clicking the “…” button, then click Save Dashboard to save changes and then select Rename Dashboard and rename it. In this example, we would rename it to “Orders: 45 days”.
Transfers: 30 Days Dashboard
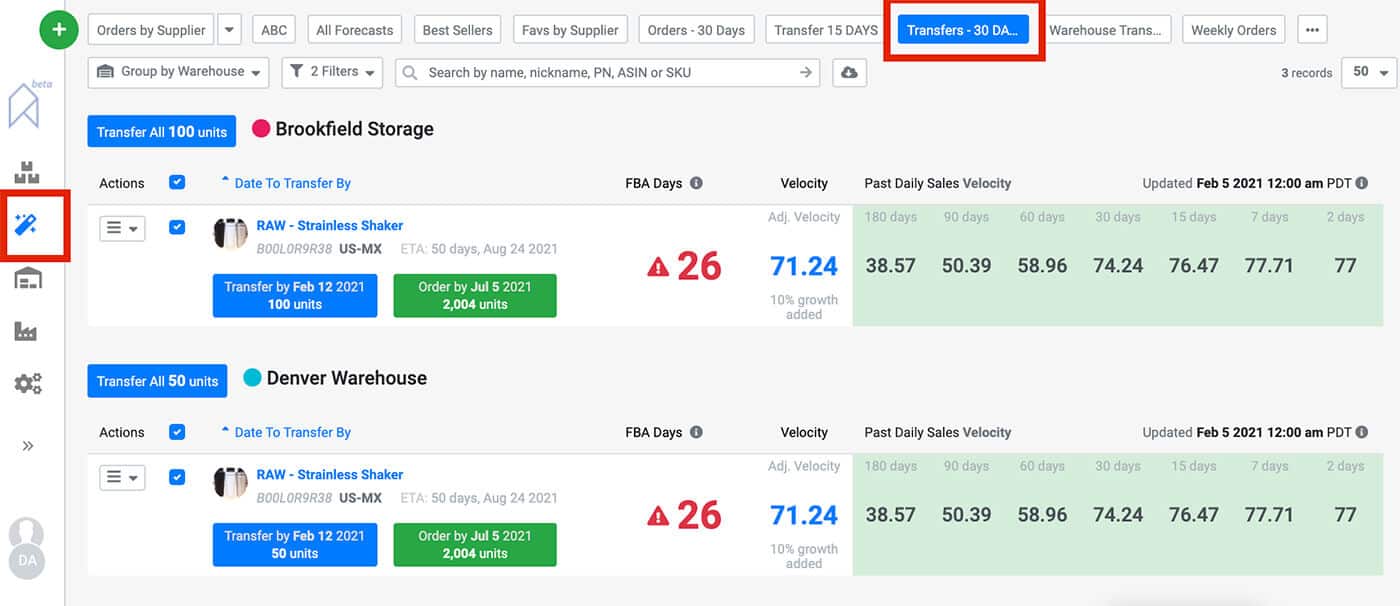
Transfers: 30 Days is very similar to the above Orders: 30 Days dashboard. The difference is that transfers refer to moving inventory from a warehouse to Amazon, whereas orders refer to orders placed with manufacturers or suppliers, not warehouses. This dashboard is grouped by warehouse. See all of the transfers needed from each warehouse and in one click generate instructions to your warehouse.
Slow-Moving Products Dashboard – Customized

The Slow-Moving products dashboard is a customized dashboard we’ve created, and so can you! Use this dashboard to quickly isolate and review your slow-moving products.
Filter:
- Status is Active
- Velocity is greater than a slow daily sales number (for example, 5)
- Velocity is less than a decent daily sales number (example, 20).
This locates slow-selling products that need boosting. Slightly different than the Liquidate dashboard we mentioned when discussing the Inventory page.
Bonus: You can also add a Marketing tag using the same methodology above for tags. This allows you to quickly view tagged products from your Forecast page and create customized forecast settings based on tags.
Forecast by Marketplace – Customized
Status: Active. Marketplace or Region is filtered i.e., if you want to see all the EU minus the UK products (Brexit). Filter by Region or Marketplace and only see that particular Marketplace or Region. Regions are defined as Marketplaces, such as US, MX, CA that have been grouped into several combined marketplaces (as when using NARF – North America Remote Filfillment) using the Regional Grouping Settings found in the Product Page of each individual product.
Amazon Order Tracker Dashboards
Landing in 30 days Dashboard – Default
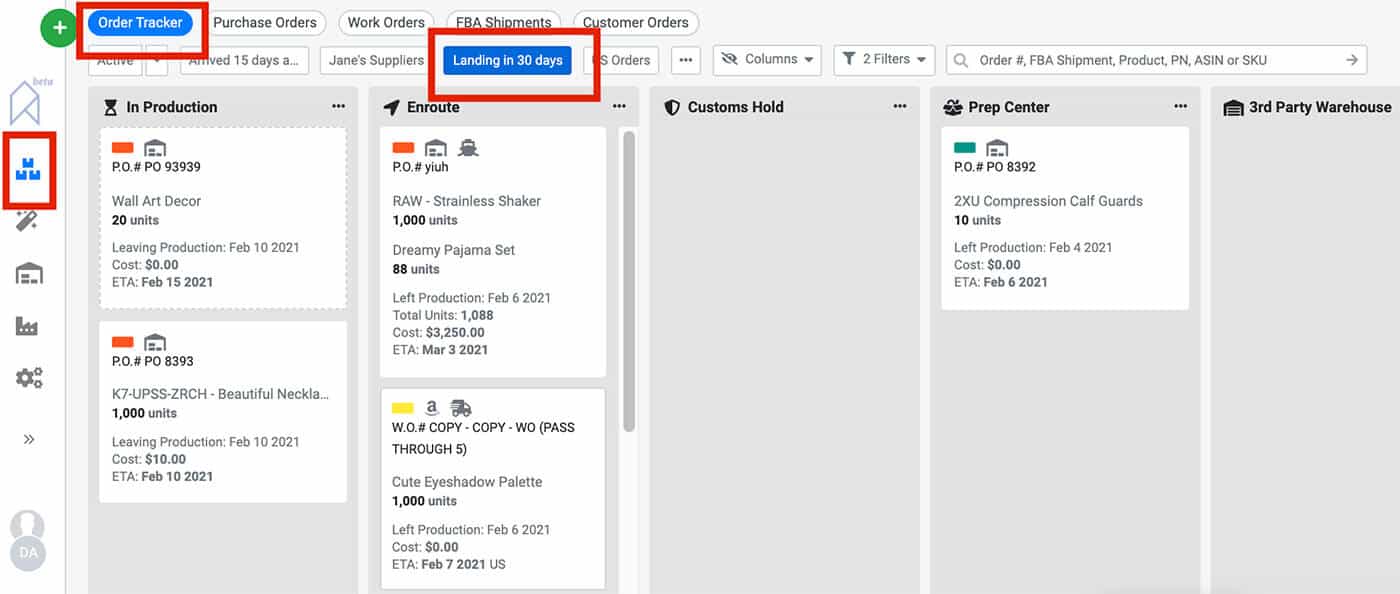
Our default Landing in 30 Days dashboard can be accessed on the Orders section of SoStocked, under the Order Tracker tab. This dashboard pulls up all orders or shipments scheduled to arrive at their final destination in the next 30 days. This helps you to focus on the short-term orders without being distracted by long-term future orders.
Arrived 15 Days Ago Dashboard – Default
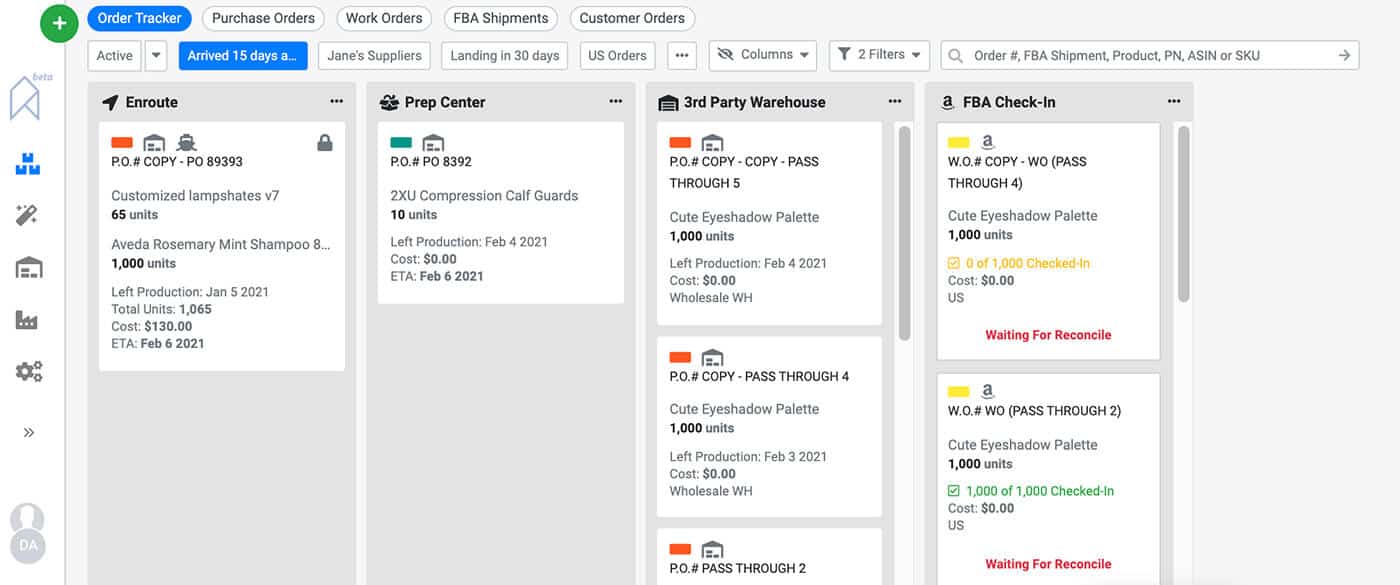
Our Arrived 15 Days Ago dashboard can also be found on the Orders section under the Order Tracker tab. This dashboard shows everything that has arrived in the past 15 days. Check on any warehouse orders to confirm everything that was supposed to arrive actually did arrive. Follow up on anything that didn’t arrive or adjust arrival dates for anything that is running late.
Pro Tip: You can also see FBA shipments that need to be reconciled with existing POs or WOs inside of StoStocked, to ensure you do not double-count inventory.
The Missing FBA Inventory Dashboard – Default
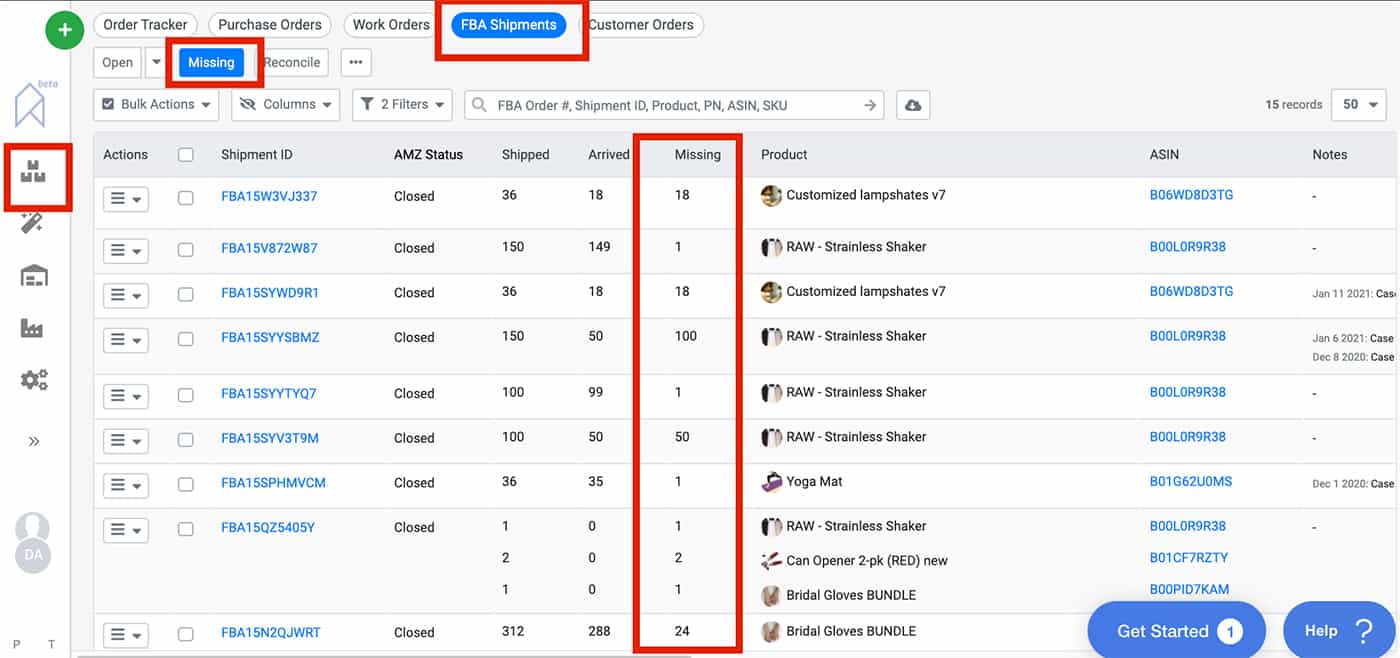
Select the FBA Shipments tab, then select the Missing dashboard. Do you ever have inventory that goes missing at Amazon FBA? This dashboard can save you! It’s pre-set to filter for:
- Where Amazon status is Closed
- Missing inventory is greater than 0.
This effectively shows you all missing inventory units that you can submit for reimbursement. Amazon will not accept reimbursement requests until the shipment is closed.
Pro Tip: Have your VA log into SoStocked once a month and review this dashboard. Then submit cases to Amazon asking for reimbursement.
FBM Orders to Deduct Dashboard – Customized
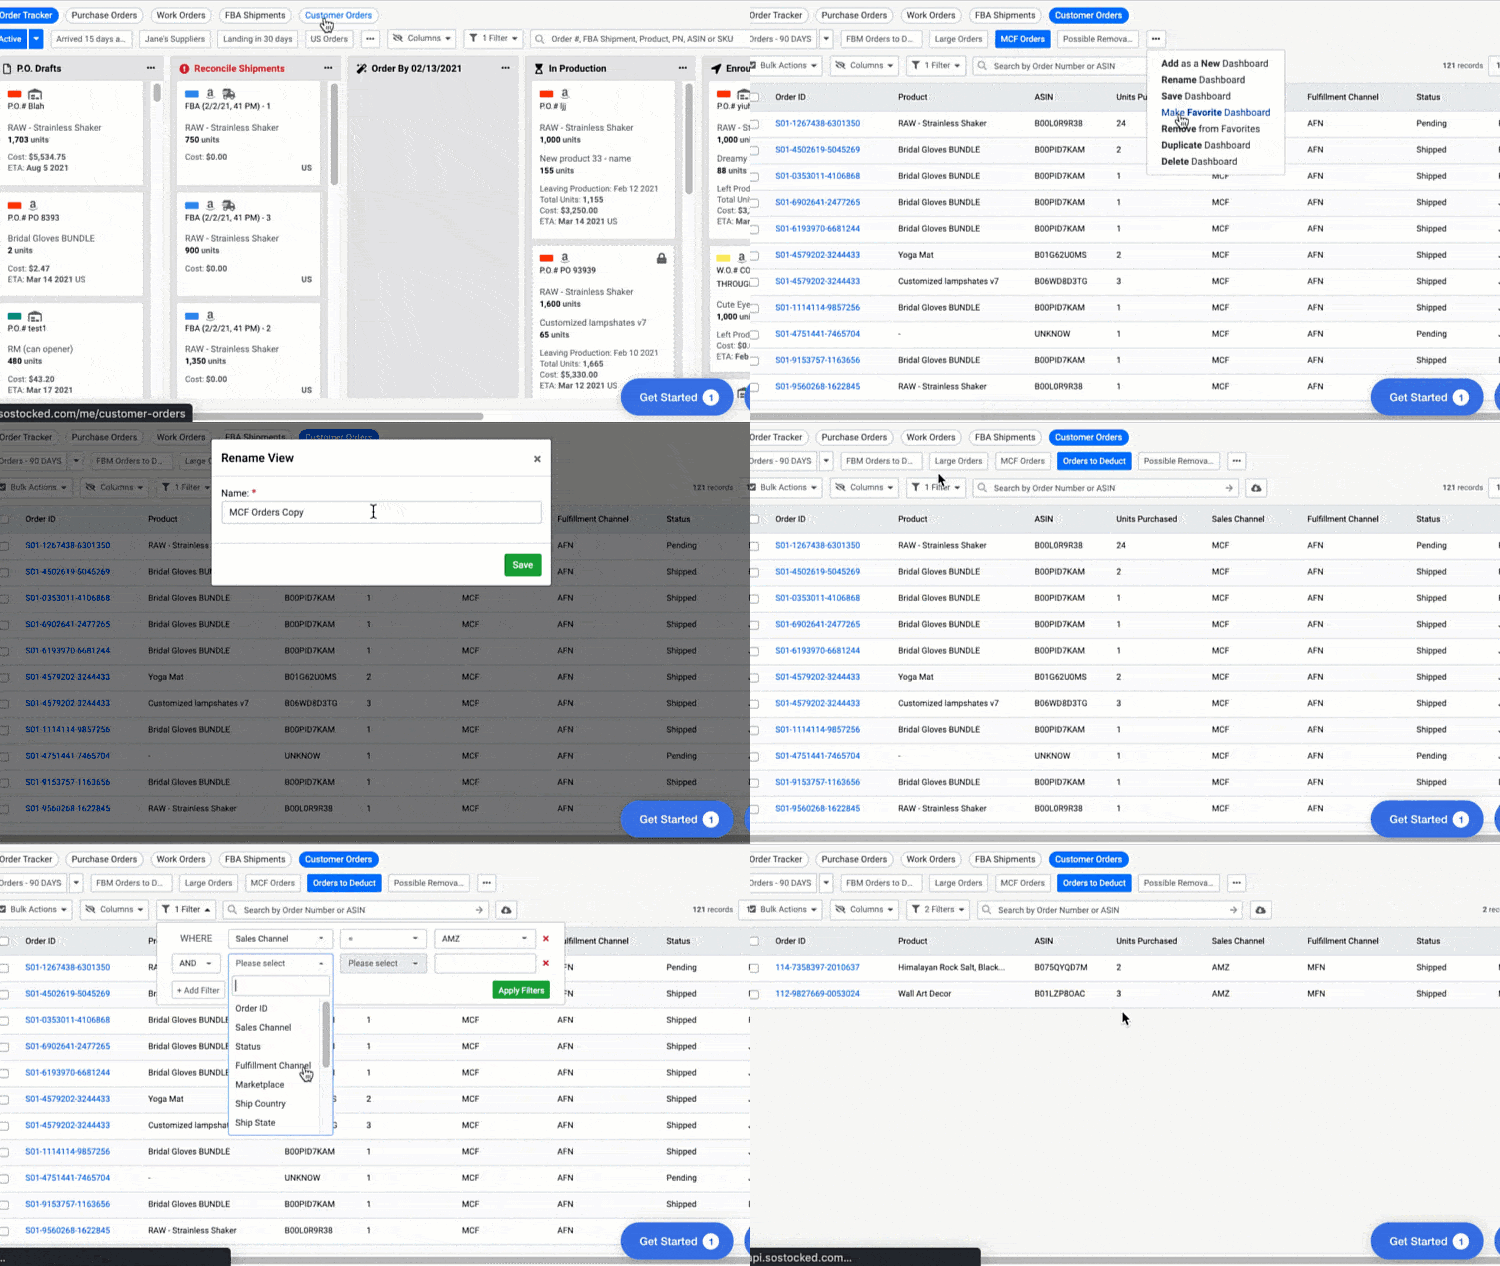
Last but not least we will review our semi-customized FBM Orders to Deduct dashboard under the Orders page and Customer Orders tab.
This dashboard was designed to help you to quickly deduct FBM units from your warehouse inventory levels. Keep better accounting of your warehouse inventory!
The reason you will want to customize this particular dashboard is that the start date for deducting orders will have to be customized based on the first date you started tracking warehouse inventory in SoStocked.
To customize this dashboard, click on the FBM Orders to Deduct dashboard and Filters and change Date Purchased to whatever date makes sense for your business. Then save the report using “…” and Save Dashboard.
Any dashboard can be duplicated and customized easily by following the below steps:
- Once you’ve selected a dashboard you want to adapt, click the “…” button on the far right to access the menu. Choose Duplicate Dashboard.
- You will now see the name of whatever dashboard you have just duplicated, plus the word “Copy”.
- Now click on the “…” button again and select Rename Dashboard. Rename your new customized dashboard.
- Now adjust the Filters to your liking and click the “…” button again and click Save Dashboard.
Set Up Your Custom Amazon Seller Dashboards
Amazon seller dashboards are a fast and easy way to help you navigate through a myriad of inventory data to see only what you want. These 15 dashboards are only a small sampling of the possibilities you can create in your own SoStocked account.
Log in to your SoStocked Amazon inventory management software to set up your own custom dashboard and keep an eye on your vital KPIs. Get a 360-degree view into your inventory, forecasting, and tracking and start making decisions based on “good data” instead of “gut feel”.
Need more information?
- Send Message: We typically reply within 2 hours during office hours.
- Schedule Demo: Dive deeper into the nuances of our software with Chelsea.
- Join Live Upcoming Webinar: New to Amazon inventory management? Learn three inventory techniques you can implement right away.
 Start Your Free Audit