Basic Economic Order Quantity Formula to Calculate Your Ideal Order Volume
Calculate EOQ to Minimize Stockouts and Overstocks
Two of the biggest mistakes that sellers often make are under-ordering and over-ordering. These inventory pains are normally caused by poor ordering and restocking practices, such as using old or inaccurate data to forecast demand, not accounting for seasonality, relying on manual processes that are prone to errors like spreadsheets, or simply not keeping track of your inventory levels.
If you order too little inventory, you could run out of stock sooner than expected, potentially resulting in lost sales, lost Amazon ranking, and lower IPI score.
If you order too much, you could have your money tied up in excess inventory and storage fees.
Either way, your company’s profitability will suffer.
To stay profitable, you have to reduce the costs of ordering and storing inventory. This means you need to have some type of metric to determine the optimal amount of inventory that you should order and store in your 3PL warehouse or FBA.
And that metric is Economic Order Quantity (EOQ).
EOQ helps you to find the sweet spot where your company makes the right order quantity and maximizes profitability.
In this blog post, we’ll show you how to use the Economic Order Quantity formula, pros and cons of using EOQ, and the tools you need to optimize your restocking process.
In this Economic Order Quantity Formula guide, we’ll take a look at:
What is Economic Order Quantity?
Sometimes referred to as Economic Purchase Quantity, Economic Order Quantity is the ideal order size you should be purchasing to meet customer demand all year round and to minimize the costs associated with ordering and storing goods.
How does EOQ help minimize inventory costs?
Calculating your EOQ allows you to order the right amount of FBA inventory for replenishment. As a result, you avoid over-ordering or under-ordering, which is key to protecting your profit margins against stockout costs (lost sales and cost of using air express to avoid long stock out periods) and holding costs (warehouse fees, depreciation costs, shrinkage, and opportunity costs). More on that later.
Related: Amazon Cost of Goods Sold Formula
4 Main Benefits of Calculating EOQ
Minimize Stockouts
Stockouts can happen when you:
- Underestimate demand due to inaccurate forecasting; for example, not removing stockout periods from your calculations.
- Order or transfer inventory too late
- Fail to maintain enough buffer stock
- Encounter unexpected shipping delays
- Don’t have sufficient capital to replenish your inventory. When too much money is tied up in excess inventory and long-term storage fees, for example, it will be hard for you to fund your successive inventory orders.
When a product is unavailable on your eCommerce site, some customers may get frustrated and immediately go to a competitor to buy the same exact product they’re looking for. And if that competitor has the item that your potential customers wanted to purchase, they’ll be more likely to stay with them. This is especially true for consumable products that are highly suitable for reordering.
So, you are not just missing out on that one sale but the numerous sales that that one potential customer might transact over the course of their relationship with that competitor. That’s a higher and more difficult to calculate loss due to stockouts.
EOQ can help you better understand how much inventory you need and how often to reorder.
By calculating how much you need based on your demand forecast, you can prevent stockouts without ending up with too much inventory on hand.
Prevent Excess Inventory
In Amazon, aging inventory is subject to surcharge and long-term storage fees on top of other applicable charges. This means carrying a lot of slow sellers (products that have low sales velocity) can significantly increase your monthly FBA fees.
Inventory costs can also go up due to product damage, spoilage, obsolescence, theft, or return fraud. For instance, storing your products for too long increases your risk for obsolescence or even warehouse damage. Plus, they take up space that you could have used for additional top sellers. This is why you don’t want to hold too much inventory for months.
You can use EOQ to determine how much inventory you’ll need in the next 12 months, allowing you to plan your reorder frequencies better.
Related: 6 Causes of Amazon Unfulfillable Inventory and How to Fix them
Volume Discounts
Also known as quantity discount, a volume discount is an incentive given by suppliers or vendors to buyers who order in large quantities. It also comes in different forms:
Threshold Volume Discounting
A discount is applied after you hit a certain quantity limit. For instance, your supplier might offer a good volume discount on units bought beyond the first 5,000.
Tiered Volume Discounting
Volume discounts are offered in levels. For instance, perhaps buying 10,000 to 15,000 units of Egg Cookers will make you eligible for a 5% discount. A larger discount percentage may also be applied to larger order sizes–let’s say, offering a 10% discount for 25,000 to 50,000 units.
Package Volume Discounting
This pricing model works like tiered volume discounting and may apply more to wholesale purchasing rather than private label. The only difference is that the discounts are determined based on the pre-packaged units. For instance, you get a 10% discount for a package of 20 units, 15% discount for 40 pre-packaged units, and so on. However, if you want to order 45 units of prepackaged goods, the 15% discount will only apply to the first 40 units. And you will have to pay full prices for each of the five units.
Overall, volume discounts allow you to buy additional stock at reduced prices. Calculate your EOQ to figure out ways to divide your order into large enough batches to take advantage of your supplier’s discount offers.
Improve Overall Inventory Management Efficiency
EOQ is one of the data-driven approaches to inventory management. It takes inventory costs and sales data into account, which should offer valuable insights into your product’s profitability.
If carrying a particular product costs you a lot in holding fees, for example, ordering too much of that product can really start eating into your profits. More on this in the next section.
Using EOQ also takes some of the guesswork out of your restocking process, allowing you to make smarter decisions about inventory management.
By knowing how much inventory to order, you’ll be less tempted to procure more units than necessary when suppliers offer incentives like quantity discounts. You can easily weigh discount savings against the costs of holding too much inventory and avoid making bad financial decisions.
How to Calculate Your Economic Order Quantity?
EOQ is a valuable financial metric for sellers wanting to improve profit margins, as it allows them to look at all the costs associated with ordering and shipping inventory and therefore, make the necessary adjustments to minimize them.
Below are the three variables that make up the EOQ formula.
Annual Demand (In Units)
As the term suggests, annual demand represents the total number of units you sell yearly. You can use your past year’s sales data to help to determine your annual demand. Adding your annual marketing plans to this increases the accuracy of your projections.
Order Cost
Also known as setup cost, order costs are the expenses related to placing an order. These typically include wire transfer fees, cost to prepare purchase orders and issue supplier invoices, documentation fees, shipment inspection fees, and labor cost for processing your order once it arrives at its final destination.
Basically, you can calculate annual ordering cost as follows:
First, find your Cost per Order.
Wire Fees + Documentation Fees + Labor Costs + Other Costs = Ordering Costs per Order
– or –
$35 + $15 + $40 + $20 = $110
Then, find your Number of Orders in a year.
Let’s assume:
Annual Demand in Units: 100,000
Units per Order: 5000
Total Demand in Units per Year ÷ Units per Order = Number of Orders per Year
– or –
100,000 ÷ 5000 = 20
Finally, calculate your Annual Ordering Cost by:
Number of Orders Placed in a Year x Cost Per Order = Annual Order Cost
– or –
20 x $110 = $2,200
More frequent ordering means higher ordering costs. You’re likely to order more frequently than normal when under-ordering causes you to run out of stock too often. In that case, it would be wise to have some buffer stock on hand to prevent potential stockouts. However, holding too much buffer stock can also lead to unnecessary costs. But more on that in the next section.
Pro tip: Read Buffer Stock vs Safety Stock vs Anticipation Inventory to learn how to calculate your optimal supply chain safety net.
Holding Costs
Also known as carrying costs, holding costs are the expenses incurred while keeping your inventory in stock. These typically include:
- Annual capital cost. This refers to the costs incurred for purchasing your inventory, including any added interest or fees attached to any loan you may have taken out to pay for it.
- Cost of storing inventory
- Labor costs. These include the cost of hiring warehouse employees or 3PLs to receive, sort, store, and fulfill orders on your behalf.
- Insurance and taxes
- Opportunity cost. This is simply the losses associated with tying up your capital in one thing when you may have made more money making a different decision; for example, in slow sellers – money you could have spent on new inventory or marketing that could have been more lucrative for you.
- Inventory risk cost. This would include theft, missing inventory, and inventory that becomes less valuable or obsolete over time.
Annual Inventory Holding Cost Formula
Annual Capital Cost + Inventory Service Cost (including taxes and insurance) + Storage Cost + Inventory Risk Cost (i.e., theft, opportunity cost, shrinkage) = Annual Inventory Holding Cost
Then, get the holding cost percentage by:
(Annual Inventory Holding Cost ÷ Total Value of Inventory) x 100 = Inventory Holding Cost Percentage
Note: Total value of inventory refers to the cost of goods value of unsold inventory you have in storage.
Next, find out how much-unsold inventory you have in storage or in a warehouse and determine what it’s all worth.
Given:
Annual Inventory Holding Cost: $7,000
Total Value of Inventory: $50,000
($7,000 ÷ $50,000) x 100 = 14%
To find your holding cost per unit per year, simply:
Annual Holding Cost ÷ Annual Demand in Units = Holding Cost per Unit
– or –
$7,000 ÷ 100,000 = $0.07 per unit
Depending on industry type and business size, holding costs can range from 20% to 30% of the total inventory value.
If yours is too high, it means you’re carrying inventory that has been incurring huge capital costs, FBA or 3PL long-term storage fees (e.g., aging items), opportunity costs, or inventory risk costs.
Basic Economic Order Quantity Formula
There are various EOQ models, such as EOQ with volume discount, EOQ with perishability, and EOQ with planned shortages. However, in most cases, only the most basic EOQ formula is used in companies, which we will cover in this section.
The most basic EOQ formula works for many businesses because it easily satisfies the common desire of inventory managers–to avoid over-ordering or under-ordering as much as possible so as to minimize costs.
This model assumes that demand remains the same over a given period of time and that stock levels deplete at a predictable rate. It also assumes that inventory is restocked when needed by procuring a batch of fixed size and orders are expected to arrive on time.
So, with the fixed demand rate, stockouts can be prevented by restocking each time the inventory level nears zero.
If you simply want to know when and by how much inventory to reorder, use the formula below. But if you need to use a specific EOQ model to really fine-tune your order size based on your current situation (incorporate volume discounts or factor in planned shortages), consult a qualified accountant who will help you to customize your EOQ.
Beyond that, read on further in the article for another method of inventory management that may be more suitable for your variable needs.
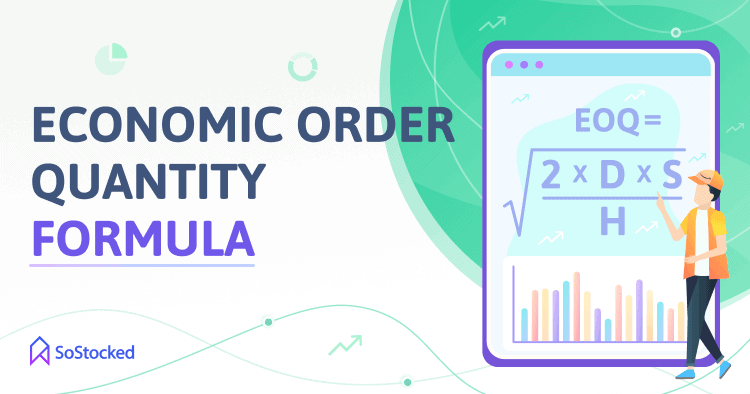
Basic EOQ Formula
Square root of: [2 x D x S] ÷ H = Economic Order Quantity
Where:
S = Setup cost per order or cost per order
D = Annual demand in units
H = Holding cost per unit
EOQ Sample Calculation
S = $110 cost per order
D = 100,000 units per year
H = $0.07 holding cost per unit
Using the EOQ formula, you’d get:
Square root of: [ (2) (100,000) ($110) ] ÷ $0.07) = EOQ = 17,728 units
Pro tip: Multiply 2 by 100,000 and $110 and then divide the product by $0.07. After doing the math, run the number through this square root calculator to get your EOQ.
Based on our computation, you should purchase 17,728 units per order or make roughly 6 (rounded off) orders per year to be able to meet your annual demand. This example also shows that you’d place 6 orders per year instead of the 20 orders you had previously been placing.
Generally, if setup or per order costs are higher, you will want to place larger orders less frequently to keep those costs down. However, if your holding costs are high, you’ll place smaller orders more frequently.
To see how this works within the formula, try changing the $110 cost per order to $175, or the $0.07 holding cost per unit to $0.12. See how each of those adjustments changes the recommended EOQ.
Basic EOQ Formula Limitations and Challenges
While the EOQ formula above offers the easiest way to calculate your optimal order quantity, it does have some limitations. As previously discussed, it assumes that:
- Customer demand remains constant over a period of time
- Inventory level reaches zero at a predictable rate
- Immediate availability of stock (i.e., your lead time doesn’t change and no shipping delays)
- No stockouts
- Volume discounts are not utilized
As you can see, the given formula does not factor in demand fluctuations, which makes it better suited for products with a demand rate that remains constant throughout the year. However, this isn’t often the case in eCommerce.
One, the demand for a product fluctuates as it moves through its lifecycle (and sometimes due to other factors like inflation and changes in consumer incomes).
Goods in the early growth stage will naturally see a surge in demand as they peak. (We’re looking at you, fidget spinner.) Then, demand goes down once they enter the late maturity phase (i.e., becoming stale or obsolete).
Two, seasonal goods often see an increase and decrease in demand depending on the time of year. Calculating your optimal order size at the start of the year and using it for the whole year could result in stockouts when the demand is high, or in another scenario, overstock inventory when the demand is low. Again, this is because the EOQ formula does not factor in seasonality.
So, if you have a seasonal business, using other inventory restocking methods and formulas that take demand fluctuations, lead time changes, among other important variables into account may be the best way to calculate your optimal order quantity.
Other EOQ challenges also include:
Inaccurate data
One of the major challenges of calculating optimal order quantity is access to accurate data. Relying on outdated systems or spreadsheets that are prone to human errors may lead to inaccurate calculations.
EOQ might not meet your supplier’s Minimum Order Quantity (MOQ)
If you’re a new seller, EOQ may generate smaller orders at first, as average annual demand is one of the key variables in calculating your ideal order size. Unfortunately, many suppliers implement an MOQ before they accept an order. Setting an MOQ allows suppliers to stay profitable while getting rid of more inventory more quickly.
Improve Restocking Efficiency with SoStocked

Fortunately, in addition to EOQ, there are other ways to optimize your overall restocking process.
Set Your Minimum (Buffer Stock) and Maximum Stock
Instead of manually checking your inventory levels to know when it’s time to reorder, you can set the following using SoStocked to automate your restocking process.
- Minimum Value, which also serves as the reorder point.
- Maximum Value, which is the highest amount of inventory you don’t want to surpass.
- Set your Min/Max on as needed basis
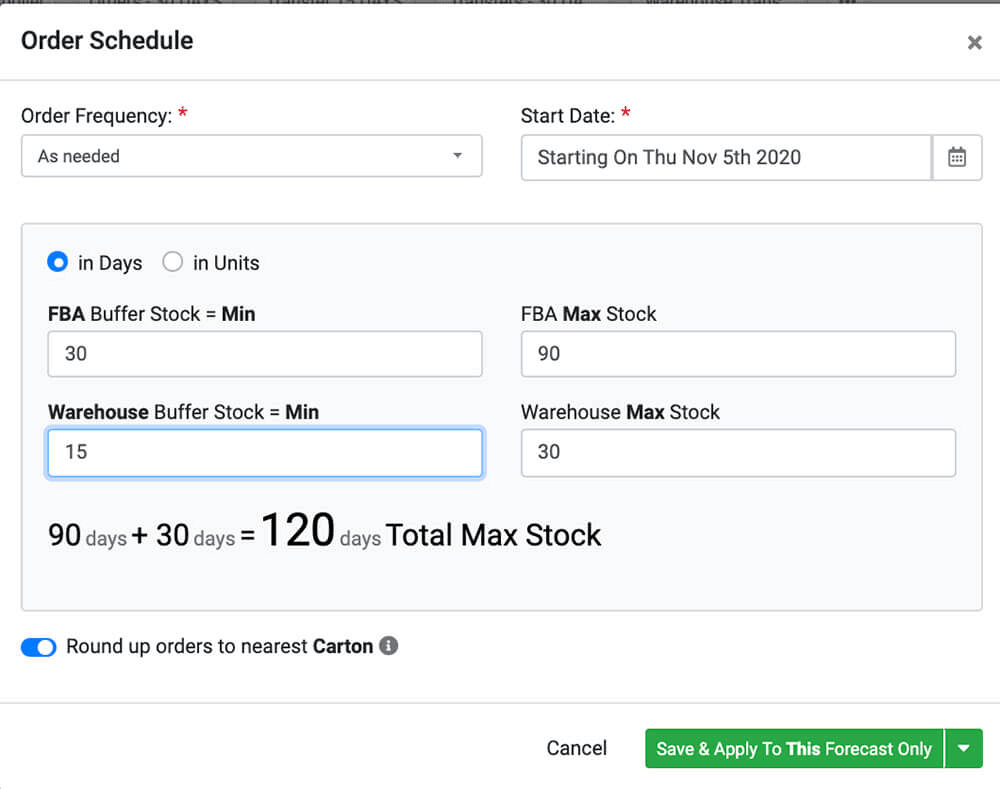
Once set, the software will automatically send reorder notifications when it’s time to replenish your inventory at Amazon.
SoStocked also allows you to easily calculate your Min-Max in Days and in Units. However, Days are preferred due to the fluctuations in your daily sales velocity that can occur from season to season, making Units less reliable.
For instance, 15,000 units worth of inventory may be ideal if you are consistently selling 500 units a day each month. However, in your peak season, if you’re selling 1,000 units each day, that’s only 15 days worth of inventory.
Calculating your Min-Max in Days means that your minimum will change based on the sales velocity for each day, week, month, quarter, and so on.
Related: Amazon Reorder Point: How to Calculate for Restocking
Demand Forecasting
As mentioned earlier, the demand for a product fluctuates at certain times of the year. Accurate and reliable demand forecasting is key to ensuring you have enough inventory to meet any expected uptick in demand.
In SoStocked, you can include a lot of variables into your forecast calculations in order to generate the most accurate projections possible. These include:
- Historical sales data
- Restock limits
- Seasonality
- Min-Max Restocking
- Future marketing plans, including Lightning Deals
- Growth trends
- Supplier lead times
- Express lead times for air shipping
You can also remove abnormal spikes in demand that are never going to repeat themselves (sales boost from a TV promotion, for example), stockout days, and Blackout Dates, allowing you to further fine-tune your forecasts.
Inventory-Minded Marketing
If you’re planning to run flash sales and ad campaigns to increase traffic and conversions on a specific product, make sure to include your promotional plans into the Forecast Page to sync your Marketing and Inventory Teams, also known as Inventory-Minded Marketing.
Let’s say your Marketing Manager wants to increase the sales of a specific product by 20% through PPC, he or she could then communicate this plan with the Inventory Team by using our Product Tagging Tool. The manager can tag the product as “Marketing” and put the marketing plans into the Forecast Page. This way, the Inventory Team can properly factor in those plans when doing their forecast calculations to see if applying a 20% sales increase would lead to any stockouts.
Purchase Order (PO) System With Lead Times
Create and send POs to your suppliers and then keep track of their progress using the Order Tracker within SoStocked. By utilizing this feature, you’ll know what inventory is In Production, En Route, or being received by your 3PL warehouse or Amazon FBA.
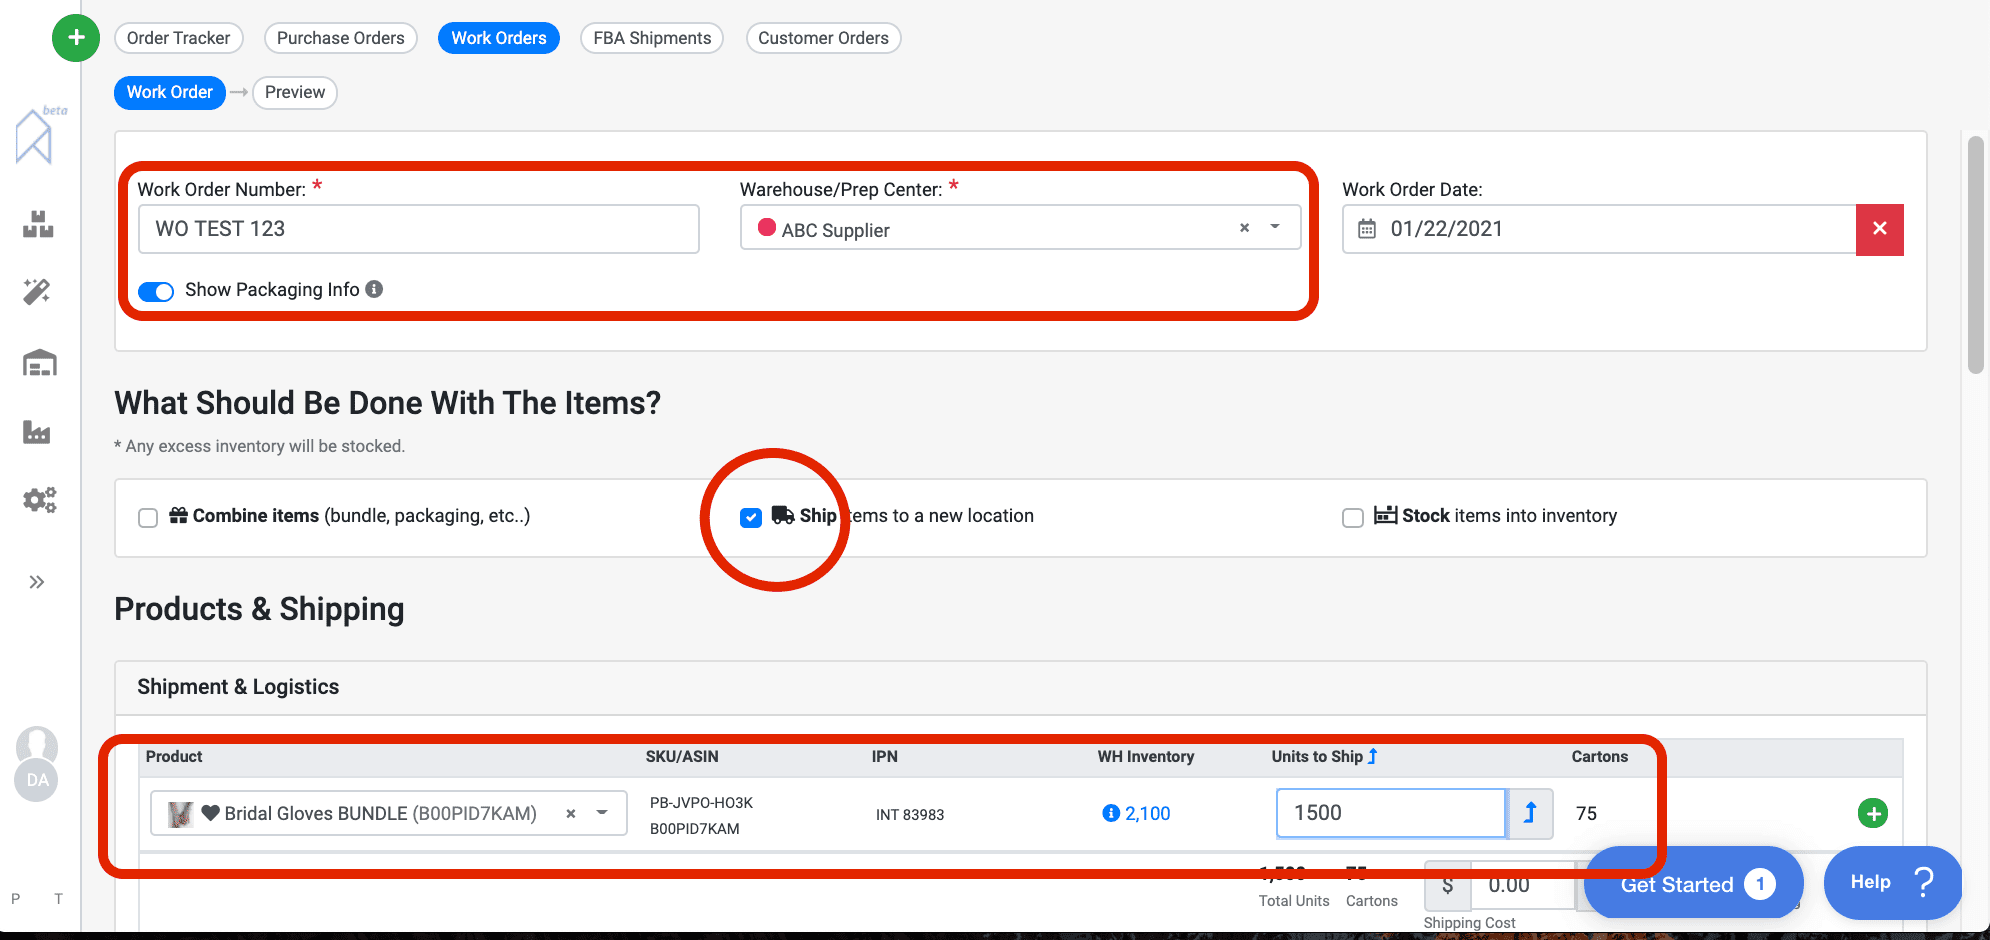
Work Order (WO) System with Transfer Times
Track any shipments that are en route from 3PL to FBA with our Work Order system. This system utilizes transfer times instead of supplier lead times to track your inbound inventory.
Suppose you need to ship your inventory from a warehouse in the US to another in Canada. In that case, create a WO and set a Transfer Time (e.g., 10 days) to provide your 3PL with an estimate of the total number of shipping days, from the day you tell them to ship your inventory to the day it arrives at FBA, allowing you to keep things on schedule.
Work Order Creation
Edit Transfer Time

You can also include a set of instructions in your WOs so that your warehouse staff knows what to do with your existing and arriving inventory. You can ask them to:
- Store your inventory
- Bundle multiple items into a single pack
- Send inventory to Amazon
- Palletize your shipments
- Affix FN-SKU labels to your products
Free Amazon Inventory Spreadsheet Template
Our Amazon Inventory Spreadsheet is designed for sellers with just a few SKUs with fairly modest sales velocity. It features:
- Formulas for inventory forecasting
- Sales spikes tracker sheet
- Stockout tracker sheet
- Reorder recommendations
Using these features will allow you to:
- Factor abnormal sales spikes and stockouts out of your data.
- Factor in seasonality, Lightning Deals, and projected growth from planned PPC campaigns.
- Calculate the order quantity for each product, as well as the amount of replenishment inventory that needs to be transferred from your 3PL warehouse to Amazon FBA.
After inputting all the information required to find your optimal order quantity, the template will show you:
- Days until stockout
- Recommended order quantities for reorder and transfer
- Dates to reorder and transfer additional inventory
Establish Optimal Order Volume and Frequency to Stay In Stock
When you know how much inventory to order and by when, you’ll feel much less anxious about stocking out or overstocking.
Calculating EOQ can help you to make informed decisions when it comes to buying and managing inventory. It also provides an annual overview of your inventory needs, which will help you to do proper financial planning for the next 12 months.
If you need to adjust your order quantities to account for seasonality and lead times, use other replenishment strategies like Min-Max Restocking or Reorder Point. This will allow you to create more accurate forecasts and order schedules, especially during peak season.
All in all, EOQ and other restocking methods should give you the data-driven results that you need to maximize business profitability (incorporating total costs and revenue into profit analysis to better understand your company’s margins and how to improve them).
Need more information?
- Send Message: We typically reply within 2 hours during office hours.
- Schedule Demo: Dive deeper into the nuances of our software with Chelsea.
- Join Live Upcoming Webinar: New to Amazon inventory management? Learn three inventory techniques you can implement right away.
Chelsea Cohen is an Amazon seller, speaker & consultant. An Amazon expert, her regular clients include 7 & 8-figure sellers. She has been featured on AM/PM Podcast, 7-Figure Sellers Summit, and the Prosper Show & Amazing Summit stages, among others.