7 Top Amazon Metrics Sellers Should Track
Track Amazon Metrics to Improve Performance
Want to improve the performance of your business, but don’t know which Amazon metrics to focus on?
With so many Amazon performance targets to meet and policies to follow, it can be hard to manage them all, especially amidst time and financial constraints. Next thing you know, Amazon tells you that your performance is off-target and you’re at risk of account deactivation.
But knowing what performance metrics to prioritize and how can help you streamline your decision-making process.
In this post, I’ll be discussing some of the most crucial seller metrics to track in your FBA business. I’ll also be sharing some tips for managing those metrics to maximize your success.
In this Amazon Metrics guide, we’ll take a look at:
Why Are Amazon Metrics Important?
Amazon uses quantifiable metrics to track and assess how effectively you’re achieving key seller objectives, such as:
- Keeping your best sellers in stock
- Providing excellent customer service before, during, and after the sale
- Timely deliveries
- Adhering to Amazon selling and shipping policies
If your performance is off-target, you’ll receive a notification from Amazon. This heads up gives you the chance to improve your seller performance before the situation escalates to suspension of offers and account deactivation. In some cases, though, seller accounts with very poor performance are deactivated immediately.
By keeping track of key Amazon performance metrics, you will be able to:
- Know what goals to set to keep your Amazon selling privileges.
- Gain valuable insights for improving your FBA business.
- Increase overall inventory management efficiency and productivity.
- Boost your products’ rankings, traffic and conversions.
- Measure financial performance, which is essential for maintaining healthy cash flow.
- Spot problems that might otherwise go undetected, like not responding to customer messages within 24 hours, which impacts your Customer Response Rate and Seller Ratings.
Top Amazon Performance Metrics to Track
Inventory Management Metrics
There are two factors that monitor and influence your inventory management performance within the Amazon platform:
Inventory Performance Index (IPI)
Amazon uses this advanced scoring system (0 to 1,000) to evaluate how well you’re managing your inventory. You can check your IPI score under your seller account’s Inventory Dashboard.
As of October 2021, the minimum threshold score is 450, though this changes from time to time based on Amazon’s current policies. Anything above this score is considered “good” and comes with unlimited storage space for Standard-Size, Oversize, Apparel, Footwear, Flammable, and Aerosol storage types. Conversely, anything below 450 will be subject to storage volume limitations, meaning, you will be restricted as to the amount of storage space you are allowed within Amazon’s FBA warehouses.
Amazon evaluates your inventory performance consistently but locks in your score every three months (quarterly). This means you must get your IPI score above the minimum threshold to keep from being strapped with storage volume restrictions. If you do not raise your score before the quarterly cutoff date, your restrictions will be locked in for the next 3 months. For this reason, monitoring this metric becomes extremely important, especially to those hovering in the danger zone around 450.
Your IPI is calculated based on the following factors:
- Excess Inventory: This metric refers to the number of units Amazon considers as “excess”, or more than can predictably be sold within a reasonable amount of time. Inventory can be deemed “excess” if it has more than three months’ worth of supply based on Amazon’s forecasted demand.
- Stranded Inventory: This is the number of units without active listings but with inventory still stored in Amazon FBA warehouses. Products may get stranded because of listing errors, incomplete listing information, pricing errors, or certain listing restrictions.
- Sell-Through Rate: This metric reflects the number of units sold over the last 90 days divided by the average units in stock during that period.
- In-Stock Rate: This indicates how efficient you are at restocking your products. A 100% in-stock rate means you haven’t gone out of stock on any of your products.
Monitoring your inventory levels is imperative to maintaining and improving your IPI score. Get rid of excess units, fix stranded inventory, improve your sell-through, and automate your restocking system to stay in stock.
Related: 4 Ways to Improve Amazon IPI
Restock Limits
Implemented in April 2021, the new account-level storage-type restock limits have caused many sellers to reluctantly pull a lot of inventory from FBA to make space for their best-selling stock that they need to send in.
What’s worse is that Amazon rolls out these new inventory restriction updates without prior warning, so you could go over the limit overnight. Tracking restock limits based on sell-through is a good practice though it’s not wholly reliable as Amazon, at times, lowers restock limits based, in part, upon the internal challenges that they face. Still, it is important to track the metric of weekly restock limit changes, as well as days of stock against restock limits. This would give you a frame of reference to decide whether FBM fulfillment has become an absolute necessity or not.
For example, if you sell 100 units per day and your restock limit is 1,000, your Days of Stock against Restock is 10 days. Keeping a close eye on both metrics can help minimize your risk for stockouts and inform you as to whether you need to diversify your distribution options. You can find your restock limit numbers by logging into your Seller Account and going to the Inventory Performance Dashboard.
Factor Restock Limits into your forecast calculations with this Restock Limits Tool!
Improve Utilization to Increase Restock Limits
Like IPI storage limits, several factors can also influence your restock limits, such as utilization percentage and sell-through. Amazon does count Utilization against your max inventory level, as it is composed of your current FBA inventory and inbound shipments, including those in Production, En Route, and in Receiving statuses.
If you’re not turning over your inventory as quickly as possible, not only will it increase your utilization percentage, but it’ll also impact your sell-through, making you less likely to garner a higher restock limit.
And, as you likely know, if you have a lower restock limit, it affects your ability to sell (and perform well) on Amazon as most sellers, as a knee-jerk reaction, tend to pull back on their marketing efforts due to restock limit restrictions.
Track your utilization percentage by calculating the following:
Utilization Quantity ÷ Restock Limit x 100 = Utilization Percentage
You’ll want to keep your utilization around 30% as it implies good turnover and sell-through rates, which increases your IPI score and storage volume limits. I know this seems impossible, especially with all the supply chain chaos and Amazon’s changing restrictions, so a good rule of thumb is just to monitor your sell-through rate and to constantly be sending inventory into FBA and selling through as quickly as possible.
As a frame of reference, 30% utilization should mean that you’re turning over inventory monthly. This should be shown on your IPI score as a sell-through rate of 3.
Related: 2021 Amazon Restock Limits Tips and Updates
Product Quality Metrics
Order Defect Rate (ODR)
ODR is one of the most important Amazon seller metrics to track. Since Amazon is all about putting customers’ needs first, ODR has been put in place to encourage sellers to provide excellent products and customer experience.
Hence, ODR reflects the percentage of orders with which shoppers have a bad experience during a particular period.
Sellers are required to keep their ODR below 1% to ensure customer expectations are always met. A higher ODR may restrict your ability to sell on Amazon.
There are three components of ODR:
A-to-Z Guarantee Claim Rate
This rate represents the number of orders with an A-to-Z claim divided by the number of orders in 60 days. An A-to-Z claim is generally filed because the product was damaged or defective, though there are other reasons a claim might be filed.
There are different types of claims that can impact your ODR, such as:
- Claims awarded to the claimant and for which Amazon determines that you were at fault.
- Claims for which you refunded the claimant.
- Claims for which Amazon or you, the seller, canceled the customer order.
- Claims with ongoing appeals for reversing the claim decision.
You can manage claims through the A-to-Z Guarantee Claims page of your seller account.
Negative Feedback Rate (NFR)
This metric refers to the number of orders with negative feedback divided by the number of orders in a given period. When calculating Negative Feedback Rate, Amazon looks at the date of the order, not the date on which the negative feedback was posted.
A high number of one and two-star feedback ratings are considered bad. So, it is vital to communicate with the affected buyer to identify what caused such feedback using Amazon’s Feedback Manager.
If the negative feedback discusses delivery delays or late delivery as the reason for negative feedback and you are using FBA to fulfill your inventory, these negative feedbacks can generally be removed from your record as FBA delivery is Amazon’s responsibility and have nothing to do with your performance as a seller.
Credit Card Chargeback Rate
Chargeback is the charge that’s returned to a credit card after a customer disputes a transaction on their card statement successfully.
Your Amazon Credit Card Chargeback Rate is determined by the number of orders that have received a chargeback divided by the number of orders in a given period.
It’s easy to confuse chargeback with another type of claim (e.g., A-to-Z claim), as they both involve giving refunds. But rather than going through Amazon to fix the issue, the customer goes through their credit card company to process the claim. So it’s not Amazon that makes the decision to dispute or reject the charge but the credit card company.
A credit card chargeback may happen when:
- The customer claims their order didn’t arrive.
- The customer shipped back the item but didn’t get a refund.
- The customer received a defective or damaged item.
Like Negative Feedback Rate, Amazon looks at the date of the order, not the date the chargeback was received when calculating your chargeback rate.
Review Velocity
On a related note, another review stat to create and track would be your Review Velocity. It is not on Amazon, but it’s an important metric for monitoring how many reviews you bring in per week or month against your percentage of units sold within that same timeframe.
The quality of the customer review is just as important. Negative reviews will affect a customer’s decision as to whether to purchase your product or even click through to your listing at all. So tracking your overall star review count and the quality of your reviews is important and will also help you to determine whether there are issues with your product or that batch of your product so you can make informed decisions about your business.
Brand Performance under Reports > Business Reports will give you a review count per time period.
FBM Shipping Metrics
Pre-Fulfillment Cancel Rate (PFCR)
Pre-fulfillment cancellations are cancellation requests initiated by the seller before confirming dispatch. Cancellations may be necessary when you don’t have enough stock available to fulfill an order.
For FBA sellers, PFCR isn’t exactly a cause for major concern since Amazon can simply change the product’s status to “unavailable” when stock is low. However, it’s a different story for FBM sellers. They are required to maintain less than a 2.5% PFC rate to avoid account deactivation.
PFCR is calculated based on:
Number of cancellations ÷ Number of orders taken within the same period (usually 7 days) = PFCR
You can keep your PFCR below 2.5% with effective inventory management. For example, setting your Min/Max restocking and automating your restocking process through SoStocked can help minimize stock outs and subsequently avoid unwanted pre-fulfillment cancellations.
Perfect Order Percentage (POP)
As the term implies, POP means flawlessly taking and fulfilling customer orders. This rate also reflects your ability to take orders correctly, keep your inventory in stock, and deliver orders on time. It’s basically Amazon’s standard for assessing your performance in a given period.
Amazon considers an order a perfect order when none of the following are initiated by the customer in the last 90 days:
- Cancellations
- Late shipments
- Refunds
- Negative feedback
- A-to-Z Guarantee Claims
- Chargebacks
- Buyer-initiated messages
As you would expect, if one of the above-mentioned factors was made, then an order is no longer a perfect order. Though there are instances where certain actions won’t lead to an imperfect order, because they don’t necessarily result in a negative customer experience. Therefore, Amazon doesn’t count them against your POP score. Such actions include:
- Pending orders canceled by the customer on the Amazon UK site.
- Canceled orders initiated by the customer via the Order-Cancellation option on the Amazon UK site.
- Buyer-initiated messages that aren’t directly related to an order.
- Buyer-initiated “Thank You” messages that don’t require a response. Simply mark these messages as “Response Not Necessary.”
Use the formula below to get your Perfect Order Percentage:
(Number of Perfect Orders in the last 90 days ÷ Total Number of Orders Received during the given period) x 100 = Amazon POP
For example, if you have had 500 orders and 450 perfect orders in the last three months, your Perfect Order Percentage would be 90%.
Not all sellers are expected to achieve a flawless order score. For instance, apparel and footwear categories normally have high product returns rates since many customers send back items that don’t fit. For this reason, maintaining a Perfect Order Percentage of 95% or higher is what’s strongly recommended by Amazon.
You can find your POP score on your Account Health page. You can also download POP reports to see which factors are affecting your score and work out a way to improve your performance.
Late Shipment Rate (LSR)
It’s no secret that Amazon doesn’t take kindly to sellers who don’t ship out orders on time, as it goes against their customer-centric philosophy. Shipping delays leave customers unhappy, which can lead to increased negative feedback and claims, negatively impacting both sellers and Amazon.
For this reason, Amazon requires FBM sellers to comply with its Late Shipment Rate policy to maintain their selling privileges. Late Shipment Rate is the percentage of orders that are handed over by the seller to the carrier after the expected ship date during a particular period. Expected ship date is the date sellers are expected to dispatch orders from the warehouse to the customer.
If you’re unable to ship an order and confirm shipment of that order on time, that’s considered late by Amazon. And therefore, it will count toward your LSR. It’s important to keep track of what orders need to be shipped and confirmed to meet Amazon’s LSR requirement, which is 4%. Otherwise, Amazon may deactivate or suspend your account until the issue is resolved.
You can calculate your LSR by:
Number of overdue orders ÷ Total orders in a given period (10-day or 30-day period) = LSR
Alternatively, you can view and download your LSR report by going to the Performance tab and clicking on the Account Health page > Shipping Performance > Late Shipment Rate.
To maintain and improve your LSR, make sure to:
- Ship orders by the expected ship date.
- Confirm orders as soon as your carrier picks them up.
- Keep an eye on your late shipment score.
To confirm shipment after shipping an order, go to the Confirm Shipment page and fill out the required fields. You’ll need:
- Carrier name
- Ship date
- Delivery service or method used (e.g., Domestic Standard, Domestic Expedited, Domestic Two Day, International Standard, or International Expedited)
- Tracking ID provided by your carrier
- Ship-from address (address from where you dispatched the order)
Once a package has been shipped and confirmed on or before the expected ship date, the customer will now be able to see the status of their order online.
Valid Tracking Rate (VTR)
This rate represents all shipments with a valid tracking number during a 30-day time period. Customers use tracking numbers to determine where their packages are and when they can expect to receive them.
Amazon requires sellers to maintain a VTR greater than 95% at a product category level. If your VTR in a specific category falls below 95%, Amazon may restrict you to sell seller-fulfilled items within that category. You may also no longer qualify for Premium Shipping and Guaranteed Delivery.
To maintain an excellent VTR, be sure to:
- Buy and use shipping labels from Amazon’s Buy Shipping services.
- Use a carrier that’s integrated with Amazon and then assign a carrier to an order.
- Enter the carrier name, shipping service, and tracking ID into the Manage Orders page.
- Confirm the shipment of an order and update its tracking information (if necessary) before the carrier delivers it to the customer. Confirming or updating shipment information after the order is delivered means the recipient wasn’t able to track their order. Thus, it will negatively impact your VTR.
Keep an eye on your VTR metric by going to the Performance tab and selecting Account Health page > Shipping Performance and clicking View Details
Returns Rate Metrics

To reflect Amazon’s customer-centric philosophy, sellers need to maintain a high level of customer service similar to what Amazon provides, which means offering a minimum 30-day returns policy and addressing return requests within two days.
How well or how poorly you process customer returns will show in your Return Dissatisfaction Rating (RDR). This metric is based on the percentage of return requests that went unanswered within two days, were rejected incorrectly, or those that ended up receiving negative customer feedback.
Amazon recommends keeping your returns rate below 10%. This will reduce the risk of receiving A-to-Z guarantee claims and negative return feedback, which could negatively impact your ODR as discussed above.
To track and improve your RDR, make sure to pay attention to your:
- Late Response Rate. This metric refers to the time it takes you to reply to a customer’s messages. It’s best practice to respond to customer inquiries, including return requests within 48 hours.
- Negative Return Feedback Rate reflects the valid return requests that received negative customer feedback. Amazon asks customers if their return was resolved properly by the seller for every return request. If left unresolved, the return request is considered to have negative feedback.
- Invalid Rejection Rate refers to the total number of in-policy return requests that are incorrectly rejected. If a return request is in-policy, the seller must offer a full refund, approve the request, or resolve the issue immediately. If one of these conditions is not met, Amazon considers the return to be incorrectly rejected.
Seller Account Health

On your Account Health page, you’ll find a feature called the Account Health Rating (AHR). It shows you how compliant you are with Amazon’s selling policies. You’ll be rated based on the following factors:
- Number of unresolved policy violations. Any violation is reported in the Policy Compliance column with a red danger symbol.
- Severity of the violations committed.
- How you positively impact your customer’s experience with your selling activities.
The Account Health Rating (AHR) is a color-coded index. It shows:
- Good (green)
- At-Risk (yellow)
- Critical (red)
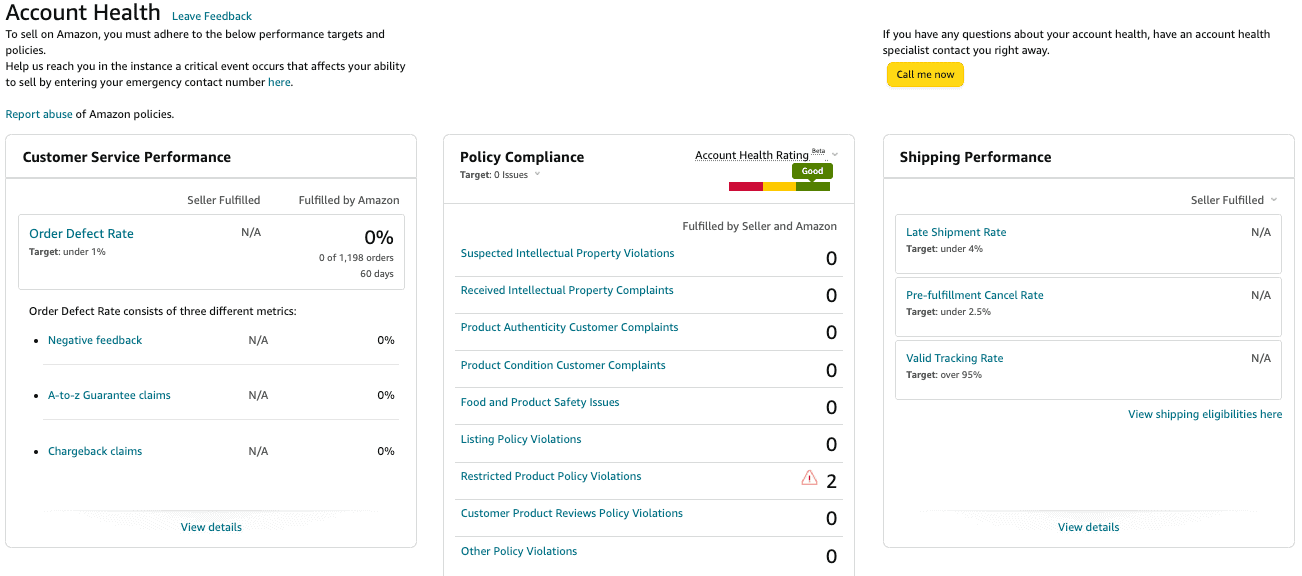
You can improve your AHR by immediately fixing any violations listed on your Account Health page. You can do that by appealing them or making the necessary changes to your listings to make sure they’re compliant with Amazon’s policies.
Listing Quality and Ranking Metrics

When a shopper goes to Amazon, their chances of engaging with your listing mainly depend upon your sales rank, as this, in large part, determines whether they will see your listing or not.
WebFX reports that 70% of customers never go beyond the first page of Amazon search results. Moreover, the first three results account for 64% of all clicks. Imagine missing out on a vast amount of opportunities because of not ranking on top of the search results page. Your Amazon SEO efforts can literally make or break your FBA business.
Three of the best metrics to look at when ranking a product are:
1. Best Seller Rank
Commonly referred to as BSR, Best Seller Rank reflects a product’s popularity relative to other products within the same category. It is calculated based on your past and current Amazon sales. Amazon also updates the BSR values every hour.
The top-selling item in its respective category automatically has a sales rank of one within that category. For instance, if your yoga mat is BSR #1 in sporting equipment, it means you sold more units than your competitors in that category during a particular time period. In other words, products with excellent sales tend to have a low BSR, while those with low sales have a higher BSR.
Therefore, BSR is usually a good indicator of how well your product is selling on Amazon. Increasing your product’s sales velocity is the best way to rank higher on Amazon. You can enhance your sales velocity by:
- Leveraging the power of advertising
- Improving your keyword optimization across all segments of your listing
- Producing highly-clickable content, including main product images and titles
- Optimizing your listing for conversion (e.g., A+ Content, infographics and copy that resonates with your target market)
Pro tip: Read my “Two Tactics that Improve Amazon Marketing Campaigns” to learn how to strengthen your online presence on Amazon.
2. Sessions
Sessions, also called traffic, is the number of unique customers who have visited your product details page within a 24-hour period. If you don’t seem to be making sales, it’s helpful to look at your sessions to see if people are having trouble finding your listing or are not interested enough to click on it when they do.
It’s important to not confuse sessions with page views. As mentioned earlier, sessions indicate how many unique individuals have visited your listing within a 24-hour period. Those same individuals may leave your listing and look at others and then come back again minutes later, but that wouldn’t be considered as another session.
Instead, those repeated views or visits would be counted toward your Page Views. That’s why the Session Percentage in your Business Report can be lower than Page Views.
Let’s say your listing had 50 sessions and 100 impressions yesterday, that means each session (unique visitor) averaged two visits to your listing within that time.
A low number of Sessions means customers don’t find your listings interesting enough to click on or that your listings are buried deep within the search results, which means you need to work on your online presence and visibility. For example, adding relevant keywords to your copy will help boost your rankings on Amazon. And of course, improving your overall Seller Performance Rating is just as important.
3. Conversion Rate
In Amazon, this is identified by Unit Session Percentage, generally. While conversion rate and Unit Session Percentage are not the same thing, we will use them in this article to mean the same.
Briefly, to understand the difference: if 1 person orders 5 units in one order, that person’s conversion rate was 100% – 1 person = 1 order. Where Unit Session Percentage is different is that in the same scenario, you also have 1 person = 5 units. The Unit Session Percentage is 500%. That is the basic difference, but on Amazon you’ll generally hear the term conversion rate used to mean Unit Session Percentage.
This represents your product’s total sales compared to the number of Sessions (unique views) it got. Like BSR, your conversion rate also serves as a good indicator of your listing’s performance and, in fact, contributes to improving BSR.
Total orders ÷ Number of sessions = Amazon Conversion Rate
So, if out of 500 sessions, 150 orders were purchased, your conversion rate would be 30%. While 30% is a good number for conversion, it could be too high for some sellers. That’s why I recommend aiming for at least 15%, especially for less experienced sellers.
If your current conversion rate is lower than 15%, it means you need to improve your marketing strategies to be more competitive. Consider working on these factors that increase conversion until you get to the ideal range that I mentioned previously:
Product copy and descriptions
Customers rely on your listing’s copy to know what they’re getting, including answers to the questions they might have in mind. If your descriptions and copy aren’t accurate or lacking in details, they might simply leave because what they are getting from you may not be clear, which could translate into a lower conversion rate.
Quality of product images
Customers may find your product page less engaging or trustworthy if you’re using low-quality images. In fact, a survey from MDG Advertising shows that 67% of customers cite high-quality photos as a very important factor when buying a product. You can improve the quality of your product photos by:
- Using larger image sizes (1000 x 1000 or more) to enable Amazon’s zoom feature. This feature allows users to zoom into your product’s photo so they could see every tiniest detail possible.
- Adding additional product images. You can have up to 8 additional images besides your main image, which allows you to show off every side of your item.
- Choosing a photo that shows how your product is being used. This step will help your customers better visualize how your product might help improve their lives or solve a problem.
Pricing
Is your price higher than your competitors without you showing the value in reviews or better features or ingredients? That could be one reason why customers are not buying from you. To be competitive, you may need to check the prices of your top competitors and adjust your pricing accordingly. But be sure to check your pricing against your expenses to see how a price reduction will impact your profit margin.
You can view your Conversion Rate (aka Unit Session Percentage) in your Seller Account’s Detail Page, Sales, and Traffic report.
Amazon PPC Metrics
Many sellers invest in Amazon PPC to drive traffic and sales. When you launch strategic PPC campaigns, your ads may start to appear both in search results and your competitors’ listings. Amazon then charges you a fee every time a user clicks on your ads.
Typically, you’re in control of the amount of money you’re willing to spend per click. But your ad spend can quickly exceed your profit if your ads aren’t performing well, i.e., not converting paid traffic into sales. So, you’ll want to make sure both your ads and listings are optimized for SEO (so potential customers can find them) and conversion (turn them into sales).
You can increase your product page’s visibility by adding relevant keywords in the product title, description, and backend keywords. As for improving conversion rates, make sure to write clear and compelling copy, use high-quality images, and maintain excellent product and seller ratings. The bottom line is the more sales you generate, the more money you can invest in scaling up high-performing ads, launching new products, and growing your business.
When measuring your PPC success, consider the following factors:
Impressions
This metric is the number of times your ad is shown on a web page or device, regardless of whether a user actually clicks through and views it.
Click-Through Rate
CTR refers to the number of clicks your ad gets divided by impressions. This indicates how many people view your listing versus the number of people who see your ad.
Conversion
In a word, sales. It is a great indicator of how successful your PPC keywords and campaigns are performing on Amazon. Conversion on ads indicates that not only is your listing well-optimized, but that your PPC keywords are highly-relevant to your product and listing.
Advertising Cost of Sale (ACoS)
is the ratio between ad spend and sales. Ad Badger reports that in 2020, the average daily ad spend is $281.21 (down from $381.48 in 2019), and the average ACoS is 27.5% (down from 34% in 2019) on Amazon. Though we imagine 2021 stats will prove to look much higher from all we can tell within the Amazon community today. Ads are getting more expensive so it is important to watch this portion of your business as it is one of the fastest ways to lose margin.
True Advertising Cost of Sale (TACoS)
It is not found in Amazon but it’s now the standard for understanding the overall effectiveness of your campaigns as they aid in organic sales boost not just ad revenue. It also helps when you are trying to calculate your true profitability after marketing. You can calculate your product’s TACoS using our Amazon FBA Calculator.
Cost per Acquisition
tells you how much you’re spending on ads to acquire a sale. Calculating how much it costs you to get a sale from your PPC efforts is essential. It also provides valuable insights into your marketing ROI, i.e., whether or not your campaign is generating revenue.
Related: Amazon Budgeting and Advertising Tips Using the Customer Journey Principle
How to Track Metrics on Amazon
Identify Your Account Type
There are two types of Seller Accounts on Amazon: Individual and Professional. The account type you select determines the Amazon metrics and reports you get.
Individual sellers can only access Seller Performance metrics, payment reports, tax document library reports, and return reports. In contrast, Professional plan users can access all of this data plus Business and Inventory reports.
These additional reports provide insights into your account’s sales, traffic, and stock levels, which you can use to improve your business.
Use Performance Reports
You can access your Performance reports via the Performance tab in Seller Central. This report typically includes:
- Seller Rating
- Order Defect Rate
- Pre-Fulfillment Cancel Rate
- Late Shipment Rate
Check Your Business Reports
Business reports contain details about the effectiveness of your sales and marketing efforts. Some of the relevant metrics that you can find within these reports include:
- Sessions
- Units Ordered
- Buy Box Percentage
- Conversion Rate (Unit Session Percentage)
Although each metric represents different aspects of the selling process, they show how successful you are in promoting and selling your products to your target customers.
For example, a high number of units ordered means your efforts to drive traffic and sales to your listings are working, whether by winning the Buy Box, investing in premium copywriting that converts, offering the best sales price, or attracting buyers with excellent product reviews.
Utilize Inventory Reports
Inventory reports generally contain data related to your inventory management, FBA stock levels, and inventory health. You can use the insights from these reports to manage your inventory at Amazon better. Meaning, minimize stock outs, slow-moving ASINS, stranded inventory, and the costs associated with them.
To view and track your inventory health, simply go to your Seller Account, open the Inventory tab and click on Inventory Reports or Manage Inventory. You can also check out the links below for more info.
- Manage Inventory Health Report
- Inventory Age Report
- Monthly Storage Fees Report
- Stranded inventory Report
- Bulk Fix Stranded Inventory Report
- Reserved Inventory Report
- Restock Inventory Report
- Inventory Reconciliation Report
- Amazon-Fulfilled Inventory Report
- Daily Inventory
- Monthly Inventory
- Received Inventory Report
- Inventory Event Detail
- Inventory Adjustments
- Inventory Health Report
- Manage FBA Inventory Report
- Manage FBA Inventory Report: Archive
- Inbound Performance Report
- Multi-Country Inventory Report
- Inventory Ledger Report
Improve Seller Metrics Monitoring with SoStocked
While many Amazon metrics are accessible within your Seller Account, tracking and handling them is no easy feat. Not to mention, there are metrics that are not available in Amazon that are as equally important, such as TACoS and Review Velocity.
Things can also get even more complicated as your FBA business grows and you start using third-party warehouses. If you’re storing inventory outside of FBA, this is not trackable within Amazon.
As such, it would be nice to have a dashboard that displays most, if not all, of your key performance indicators in real-time.
Luckily, SoStocked has several Seller Dashboards that you can customize to track critical inventory metrics, such as overstock inventory, slow sellers, restock recommendations, and more. While Amazon gives you a lot of overview information, an inventory tool such as SoStocked can get very detailed and granular about inventory management and all of its moving parts, which can help you to maintain excellent inventory control.
Examples of dashboards you can customize in SoStocked include:
Forecasting Dashboards
Orders: 30 Days
This dashboard filters down all of your future order recommendations to display only the shipments that you must purchase within the next 30 days. It is separated by Supplier; thus, you can place orders for all products from that same supplier at the same time or one product at a time, whatever your preference.
Transfers: 30 Days
This one is similar to the Orders: 30 Days dashboard. The difference, however, is that Transfers refer to any inventory to be transferred from an external third party warehouse to an Amazon FBA fulfillment center.
Inventory Dashboards
Overstock inventory
Avoid carrying too much excess inventory by knowing where you have too much stock at Amazon. You can also share this report with your marketing team so they can create a strategy for increasing the sell-through rate of your overstocked inventory, which can help in recovering tied-up capital and avoiding holding costs.
Inventory StockOuts: Future
Anticipate any upcoming potential stockouts with the help of this dashboard. This way, you can quickly develop a plan to prevent them.
Inventory On-Hand
This dashboard shows you all Available, Reserved, and Inbound FBA inventory. It also includes your Restock Limits, Inbound Total Stock, Total Stock plus Inbound, Warehouse Stock, and Max Ship Quantities per SKU.
Inbound Shipment
This dashboard shows you what Purchase Orders (POs) or Work Orders (WOs) are coming into FBA or your 3rd Party Warehouses (3PLs), helping you track all POs and WOs from production through shipping in a single view.
Slow-Moving Products
This dashboard helps you to identify slow sellers that need boosting, so they don’t clog up your restock limits or end up incurring holding costs after 90 days of remaining stuck in an Amazon warehouse.
Order Tracking Dashboard
This order tracking dashboard tells you the exact status of your PO and shipment in a Kanban view with In Production, En Route, 3PL, or FBA tabs. These tabs easily let you know who has your shipment along with other essential details clearly in view.
Want to get started? Book a demo with us today!
Avoid Account Suspension by Maintaining Excellent Performance
Understanding and meeting Amazon’s performance targets is a crucial part of running an FBA business. Not only is it essential for maintaining your selling privileges, but these metrics also offer valuable insights that you can use to improve your systems and processes.
Having a difficult time enhancing your IPI score? Look into your overstocked inventory and devise a strategy to turn slow sellers or excess inventory into profits. Or review all of your inactive listings and correct errors that may be making them unavailable for sale. Seller metrics tell you which parts of the business are working and which ones aren’t so you can quickly make the necessary adjustments.
While Amazon does a great job at monitoring and informing sellers of their performance, it is also good practice to monitor your own metrics by regularly checking your Seller Account Health and other relevant reports. It’s also best to invest in an inventory management system and any other automation tools that let you organize and track all of the most important metrics to your business to simplify these processes.
Need more information?
- Send Message: We typically reply within 2 hours during office hours.
- Schedule Demo: Dive deeper into the nuances of our software with Chelsea.
- Join Live Upcoming Webinar: New to Amazon inventory management? Learn three inventory techniques you can implement right away.
Chelsea Cohen is an Amazon seller, speaker & consultant. An Amazon expert, her regular clients include 7 & 8-figure sellers. She has been featured on AM/PM Podcast, 7-Figure Sellers Summit, and the Prosper Show & Amazing Summit stages, among others.